Packard Research GroupMechanical Engineer InternDec 2025 – presentSupported by the U.S. Department of Energy, Department of Defense and Air Force
Precision wafer-spalling system
A hinged-lid rig that brings a load cell down onto silicon wafers with micron-level repeatability. I owned it from the first sketch through CAD, machining, the Python motion and data-acquisition code, and the verification tests that proved its data could be trusted.
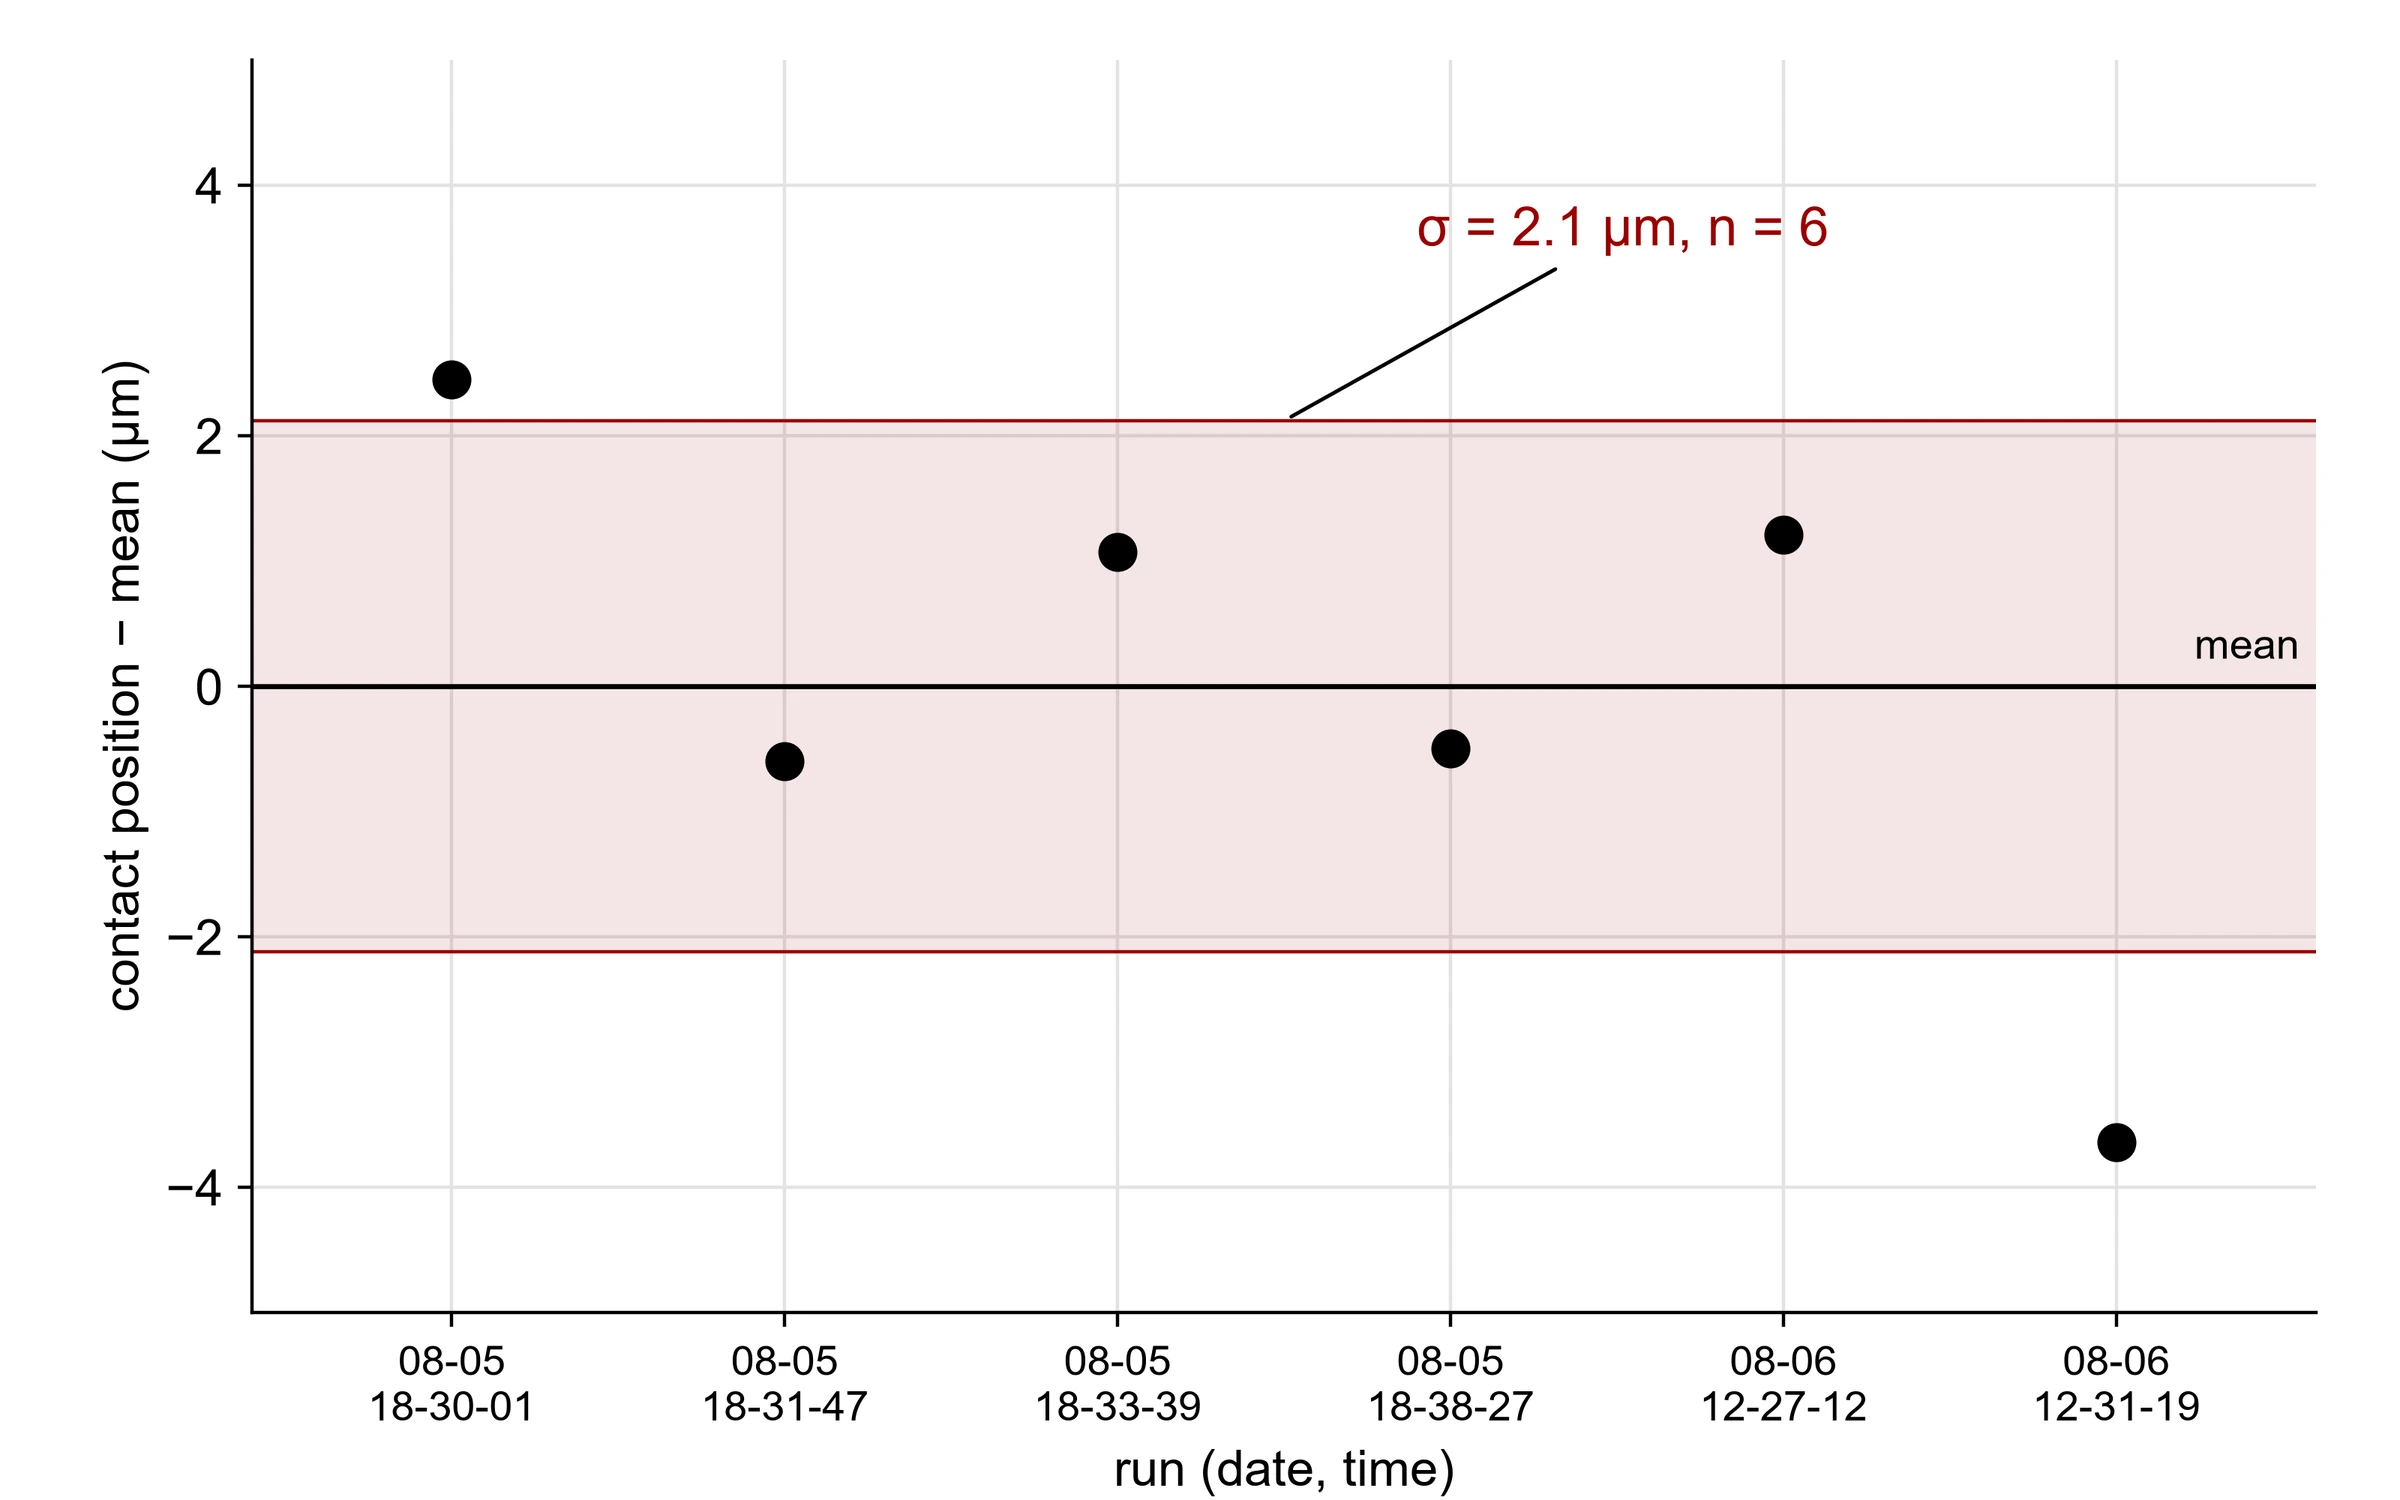
σ = 2.1 µmTouch-off repeatability, n = 6
1.4 mN rmsResting force noise floor at ~94 Hz
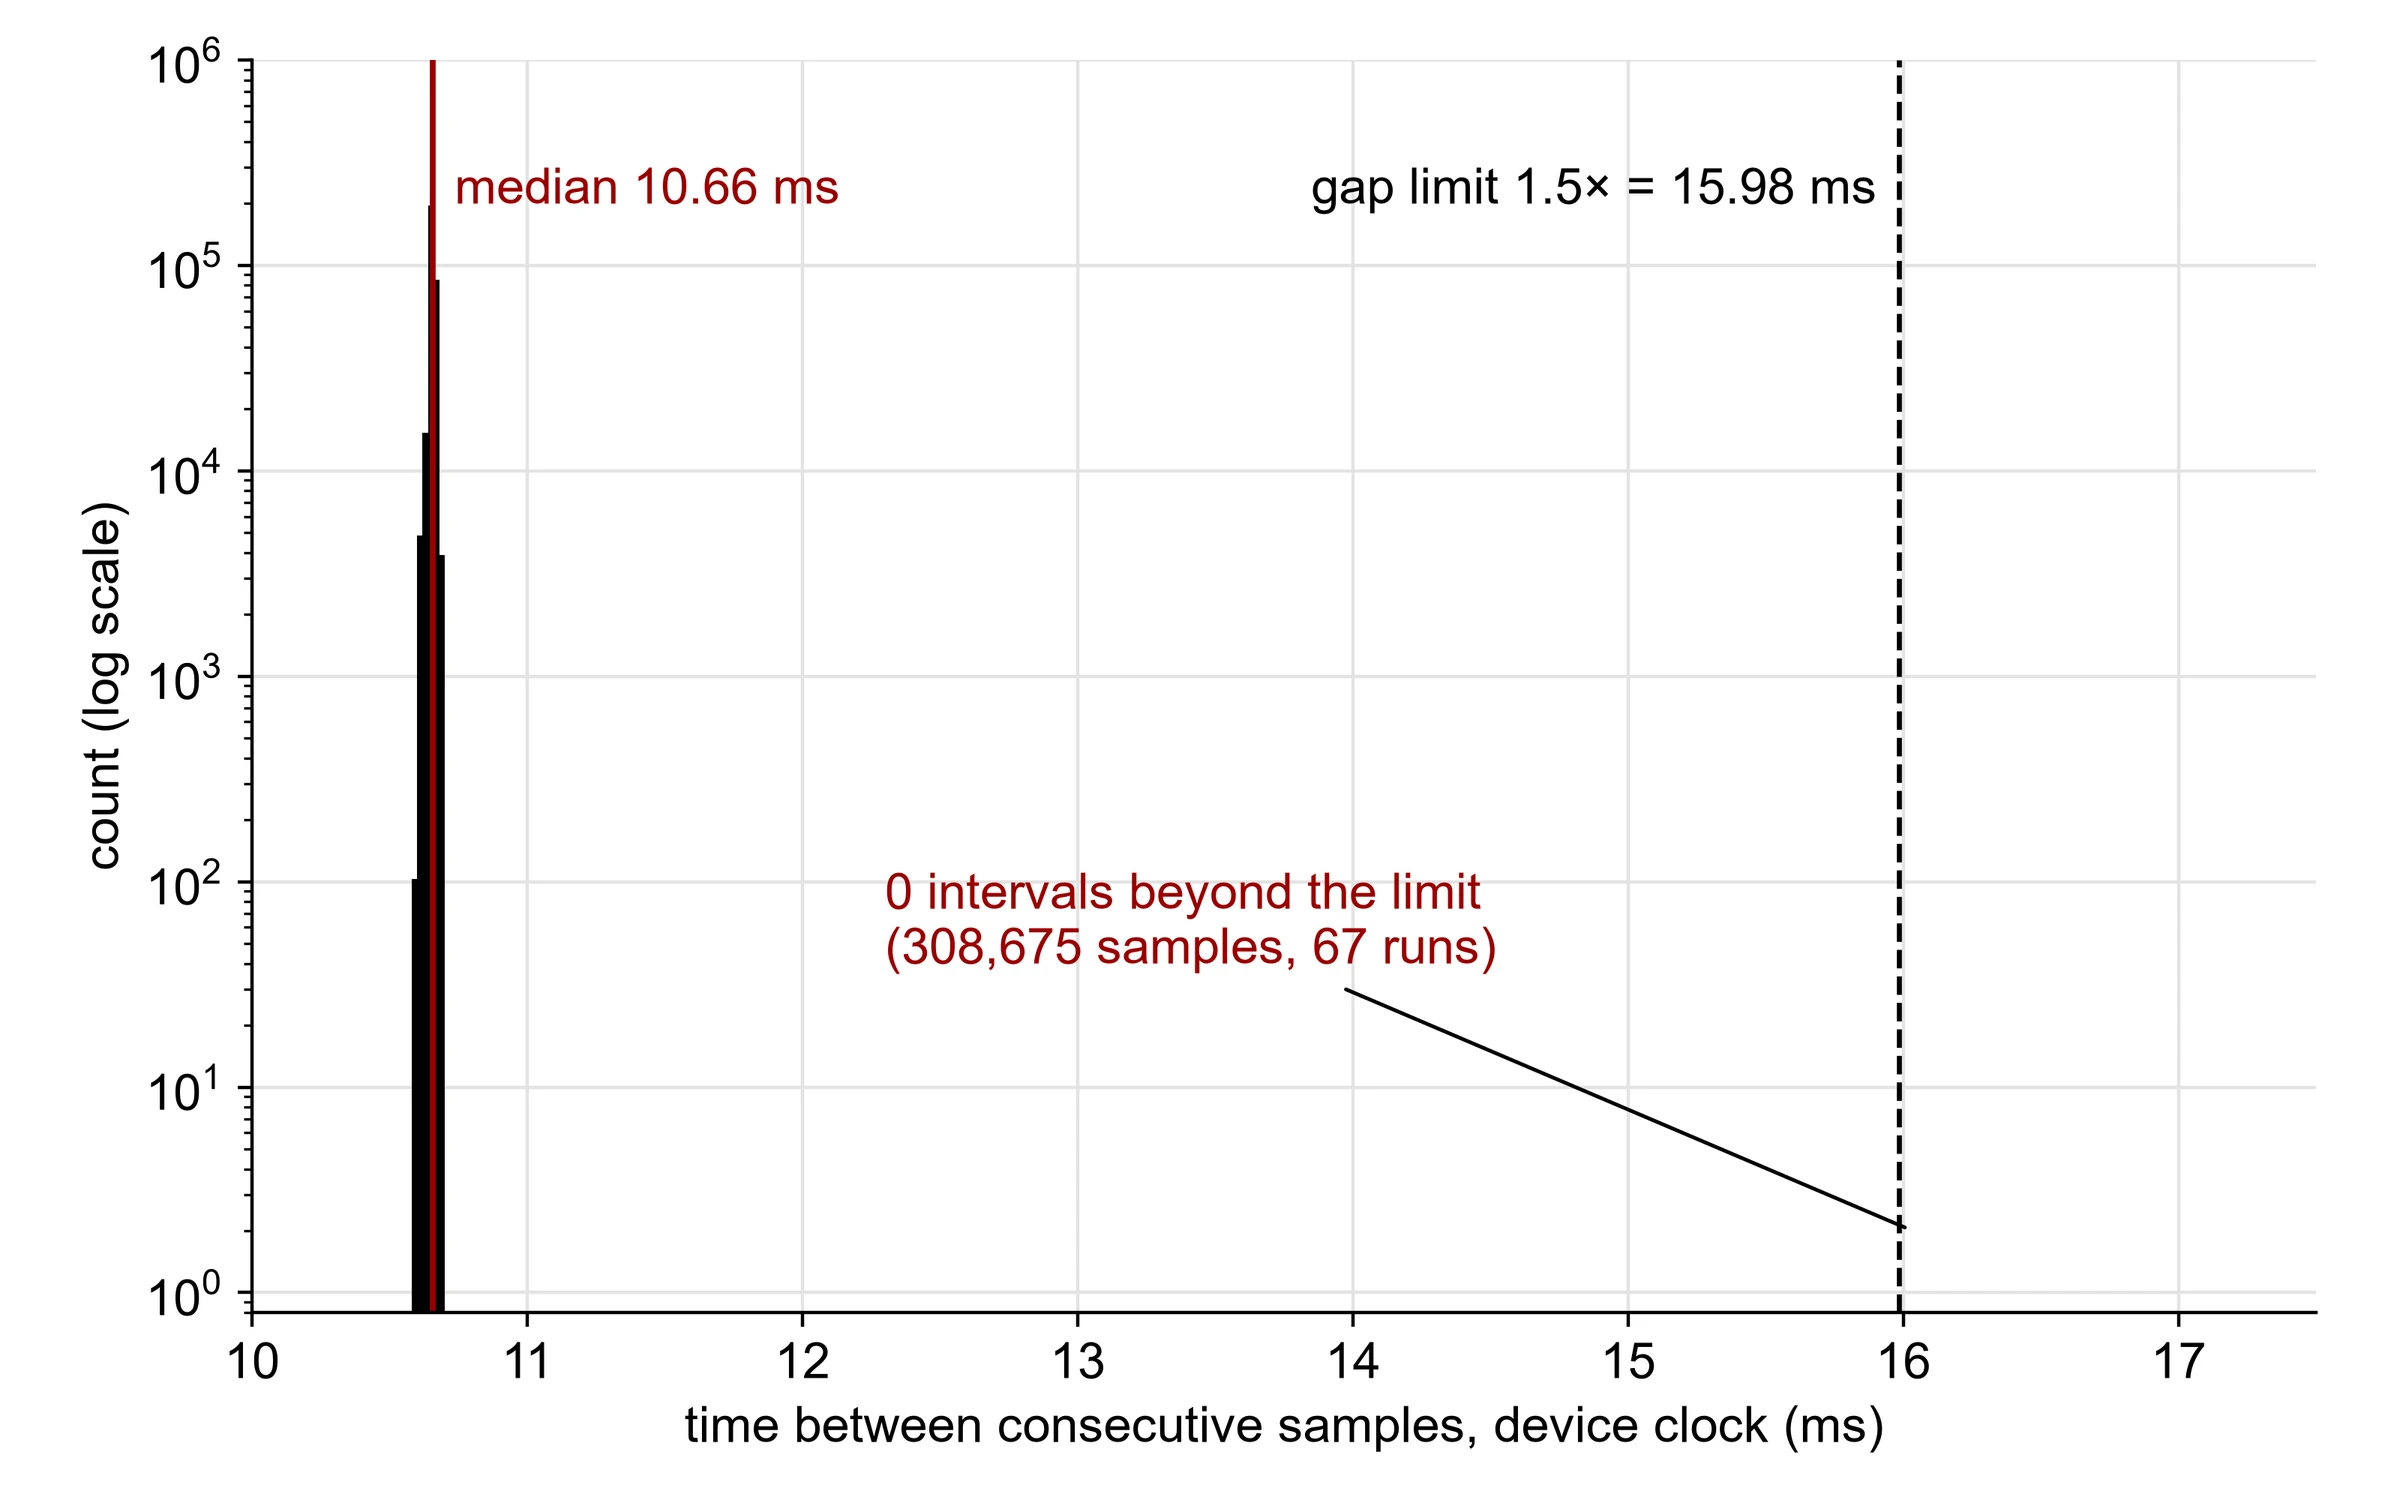
0 gapsIn 308,675 device-timestamped samples across 67 runs
67%Actuator force margin over the worst-case load
The rig
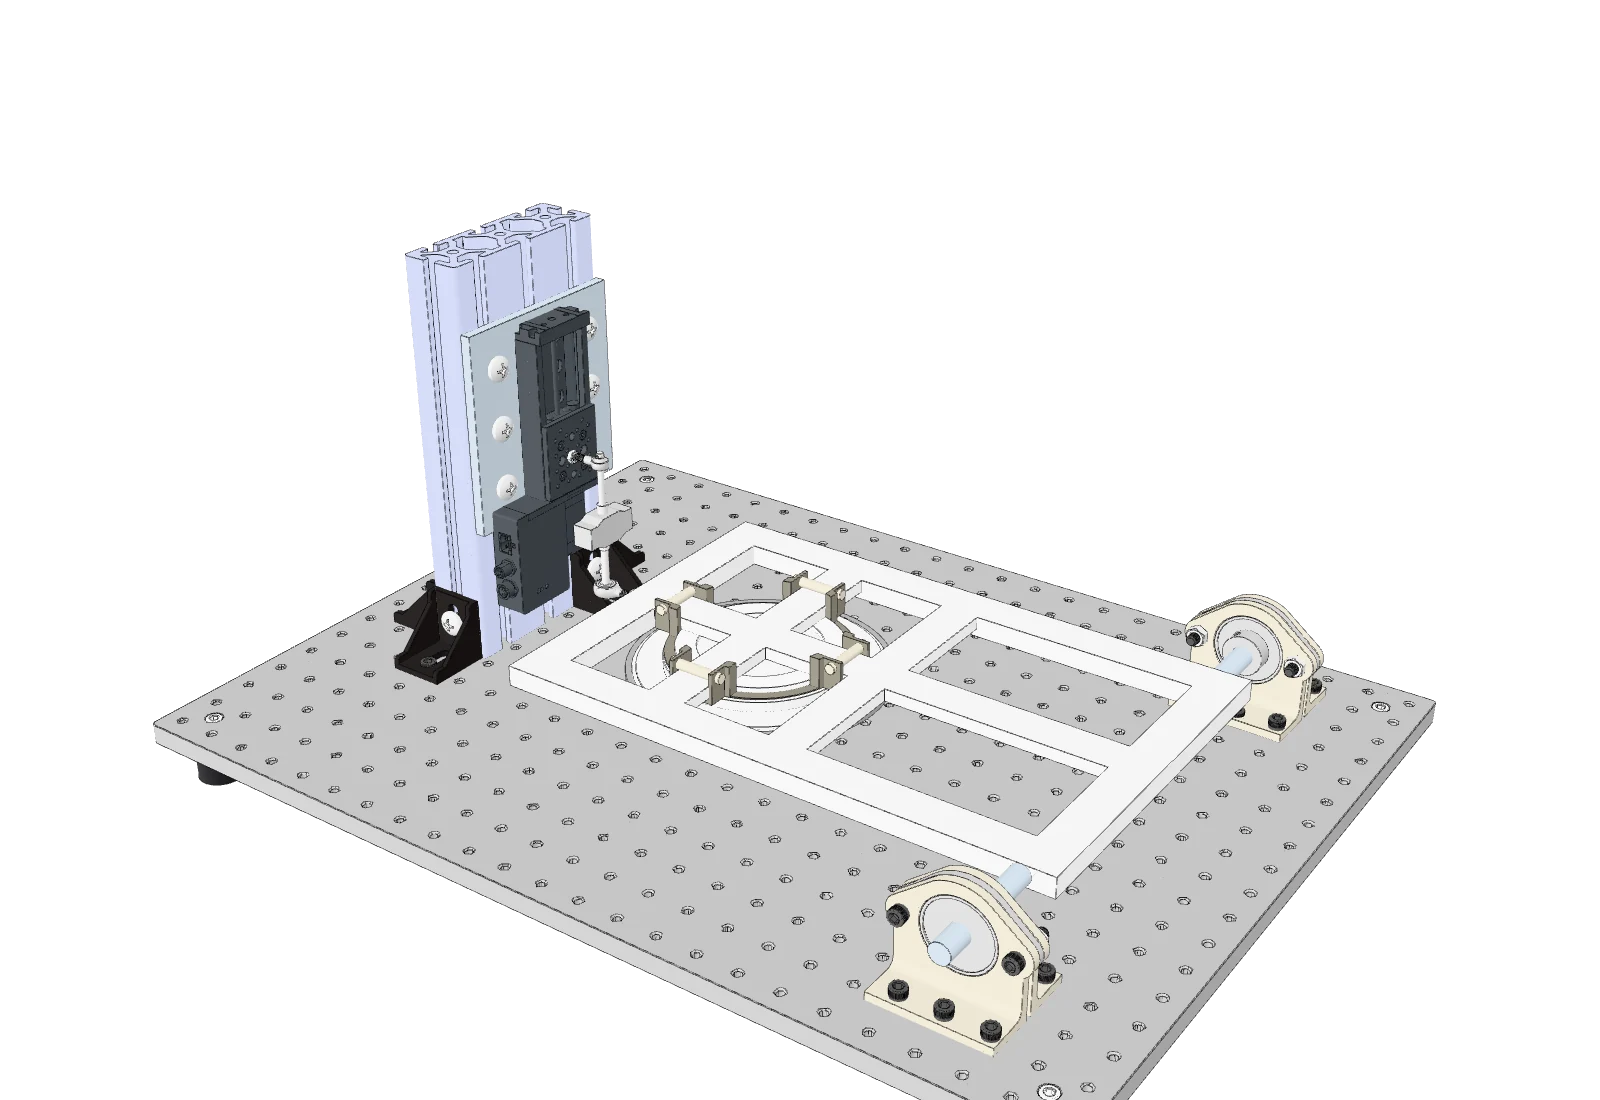
Drag to turn it and scroll to zoom. Raise the actuator to lift the lid: the load cell rides in series on the rod between them, and the lid pivots on shafts in flange bearings at the far end.
Lid angle:
The goal
Controlled spalling separates a thin layer from a silicon wafer. A stressed nickel film is plated onto the surface, and the stress drives a crack that runs just below it, lifting off a layer of silicon without sawing.
The group needed automated, repeatable spalling with controlled loading and synchronized force and position data, on a fixture designed to take 2″, 4″ and 6″ wafers.
What I owned
I was the mechanical engineer on the project, with full ownership from concept to verified data.
Concept and CADDesigned the full rig in CAD, including the hinged lid and load path.
Component selectionZaber linear stage, load cell, vacuum chuck and structure.
AnalysisForce and kinematic analysis of the hinged lid to size the actuator and load cell.
BuildMachined and assembled the hardware.
SoftwarePython motion control and data acquisition.
VerificationDesigned the tests, analyzed the data, and fixed what they found.
Design
The load cell rides on a lid that pivots on a hinge, driven by a linear stage. I chose the stage against five requirements: repeatability small compared with the touch-off displacement I needed to resolve, 50.8 mm of travel, a built-in controller I could drive from Python, a non-back-driving screw so the lid holds position under load, and enough thrust for both slow creep and fast moves.
A force and kinematic analysis of the lid through its full swing sized the actuator at a 0.67 margin of safety over the estimated worst-case load (55 N peak thrust against about 33 N), with the load cell sized at about 74% of full scale.
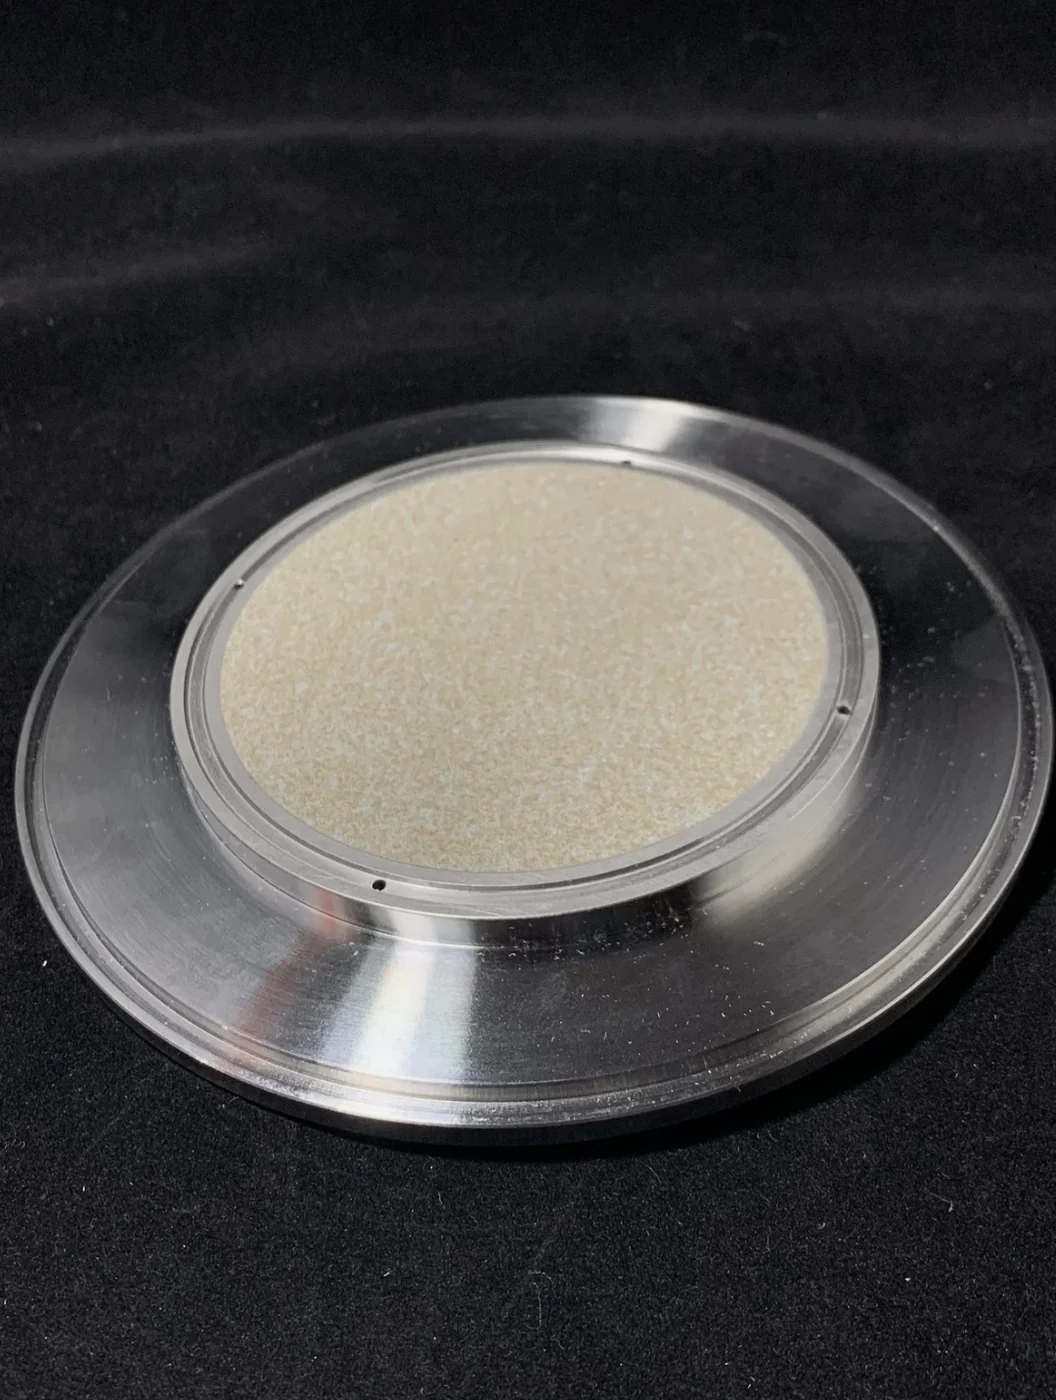
The vacuum chuck: a porous ceramic face set in a machined metal body. Vacuum pulled through the ceramic holds the wafer flat.
Build
I machined and assembled the rig and wrote the Python that sequences the motion and logs force against position. Every load-cell reading is timestamped on the microcontroller, so the data can be audited sample by sample.
Component
Part
Job
Linear actuator
Zaber X-LSM050A-S motorized stage
50.8 mm of travel, built-in controller driven from Python
Force sensor
10 lbf (44.5 N) load cell
Reads force in series on the rod between actuator and lid
Signal chain
HX711 amplifier, Arduino Uno
Digitizes the load cell and timestamps every sample
Linkage
Rod with spherical rod ends
Connects the stage carriage to the lid without binding
Hinge
Steel shafts in flange bearings
Pivot for the lid
Wafer hold-down
Porous ceramic vacuum chuck
Holds the wafer flat during loading
Base
MB1824 aluminum breadboard on Sorbothane feet
Rigid mounting grid, isolated from bench vibration
Software
Python
Motion sequencing, data acquisition and analysis
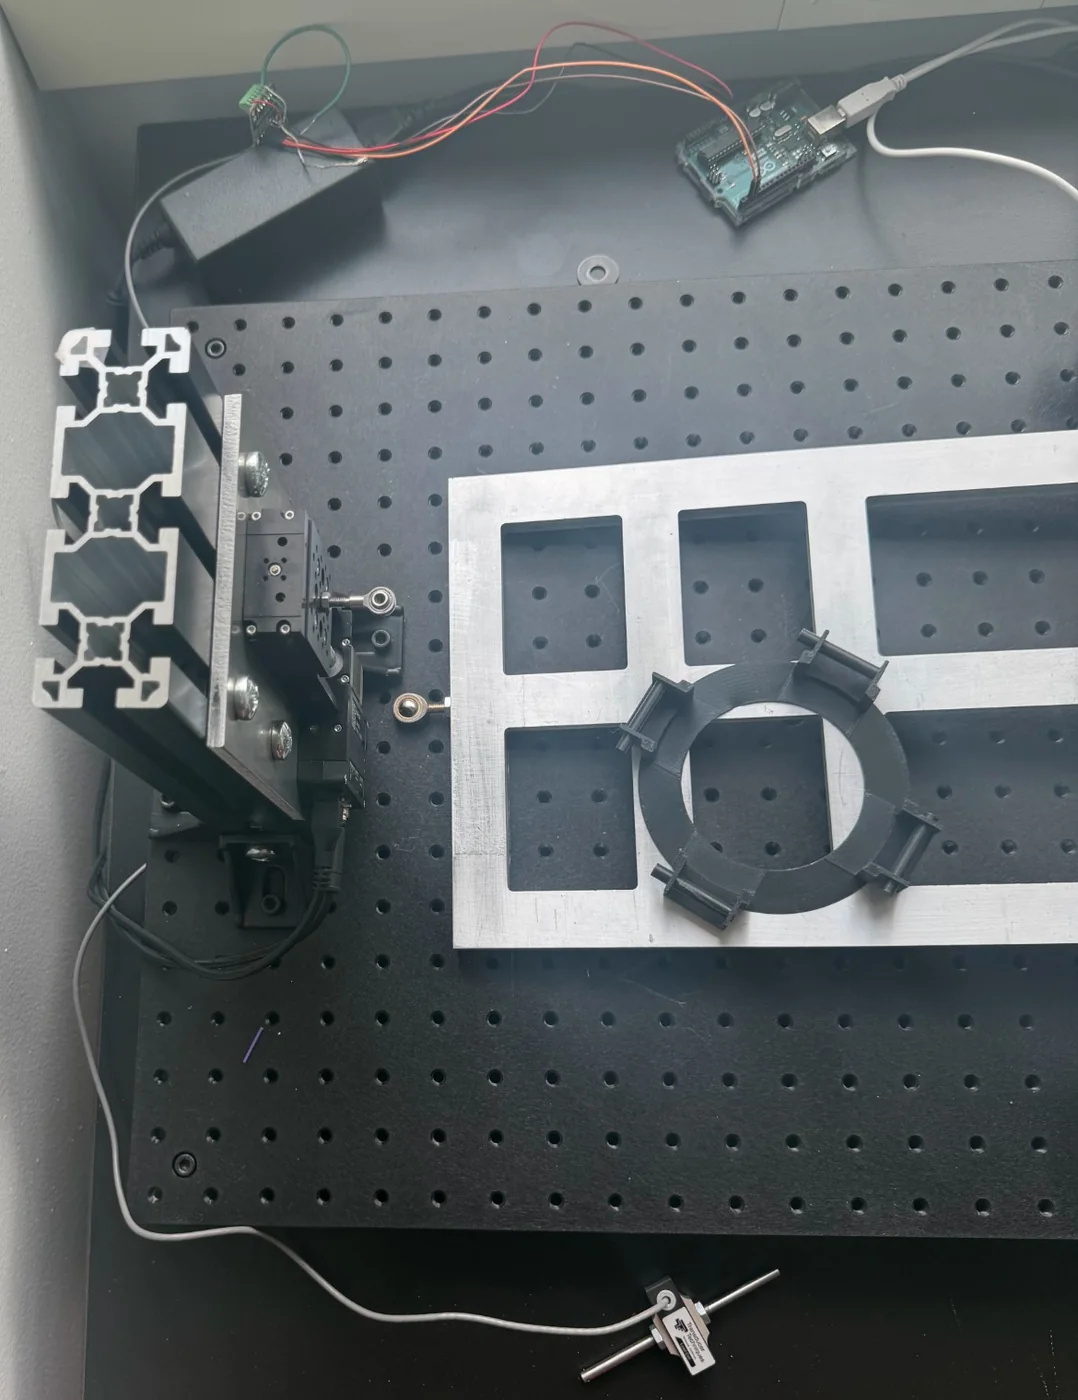
The rig on the bench, from above: stage and rod end on the extrusion column, the machined lid with its printed clamp ring, and the Arduino at the top. The load cell and its rod sit unmounted at the bottom.
Removing a redundant double read in the firmware doubled the sample rate, from 46.8 Hz to about 94 Hz.
Calibration
Span calibrationA 230 g reference mass on the load cell set the scale factor: 95,408 counts per newton.
Cross-checkThe load cell’s 2 mV/V rating and the amplifier gain predict about 94,250 counts/N. The measured value lands within 1.2%.
Drift controlEach run is zeroed before and after (a bracketed tare), and a run is rejected if its zero moved more than the noise allows.
I also wrote a multi-point in-situ routine for the next round: known masses on the lid itself, zeroed before and after, with a least-squares fit and a linearity check.
How I verified it
Before trusting any spall measurement, I qualified the measurement system itself, proving each link in the chain from the sensor’s calibration to the repeatability of the whole rig.
Check
How
Result
Load-cell calibration
Span calibration with a 230 g reference mass, cross-checked against the value predicted from the cell’s 2 mV/V rating and amplifier gain
95,408 counts/N, within 1.2%
Data integrity
Timestamp gap analysis: every sample stamped on the microcontroller, every interval checked
0 gaps in 308,675 samples
Noise floor
Resting signal with the stage stopped and nothing in contact
1.4 mN rms
Touch-off repeatability
Type-1 gauge study: repeated touch-offs on the same specimen under a fixed recipe
σ = 2.1 µm (1σ, n = 6)
Six touch-offs on one wafer: σ = 2.1 µm.Every one of 308,675 sample intervals sits at 10.66 ms; none reach the gap limit.
The touch-off rule
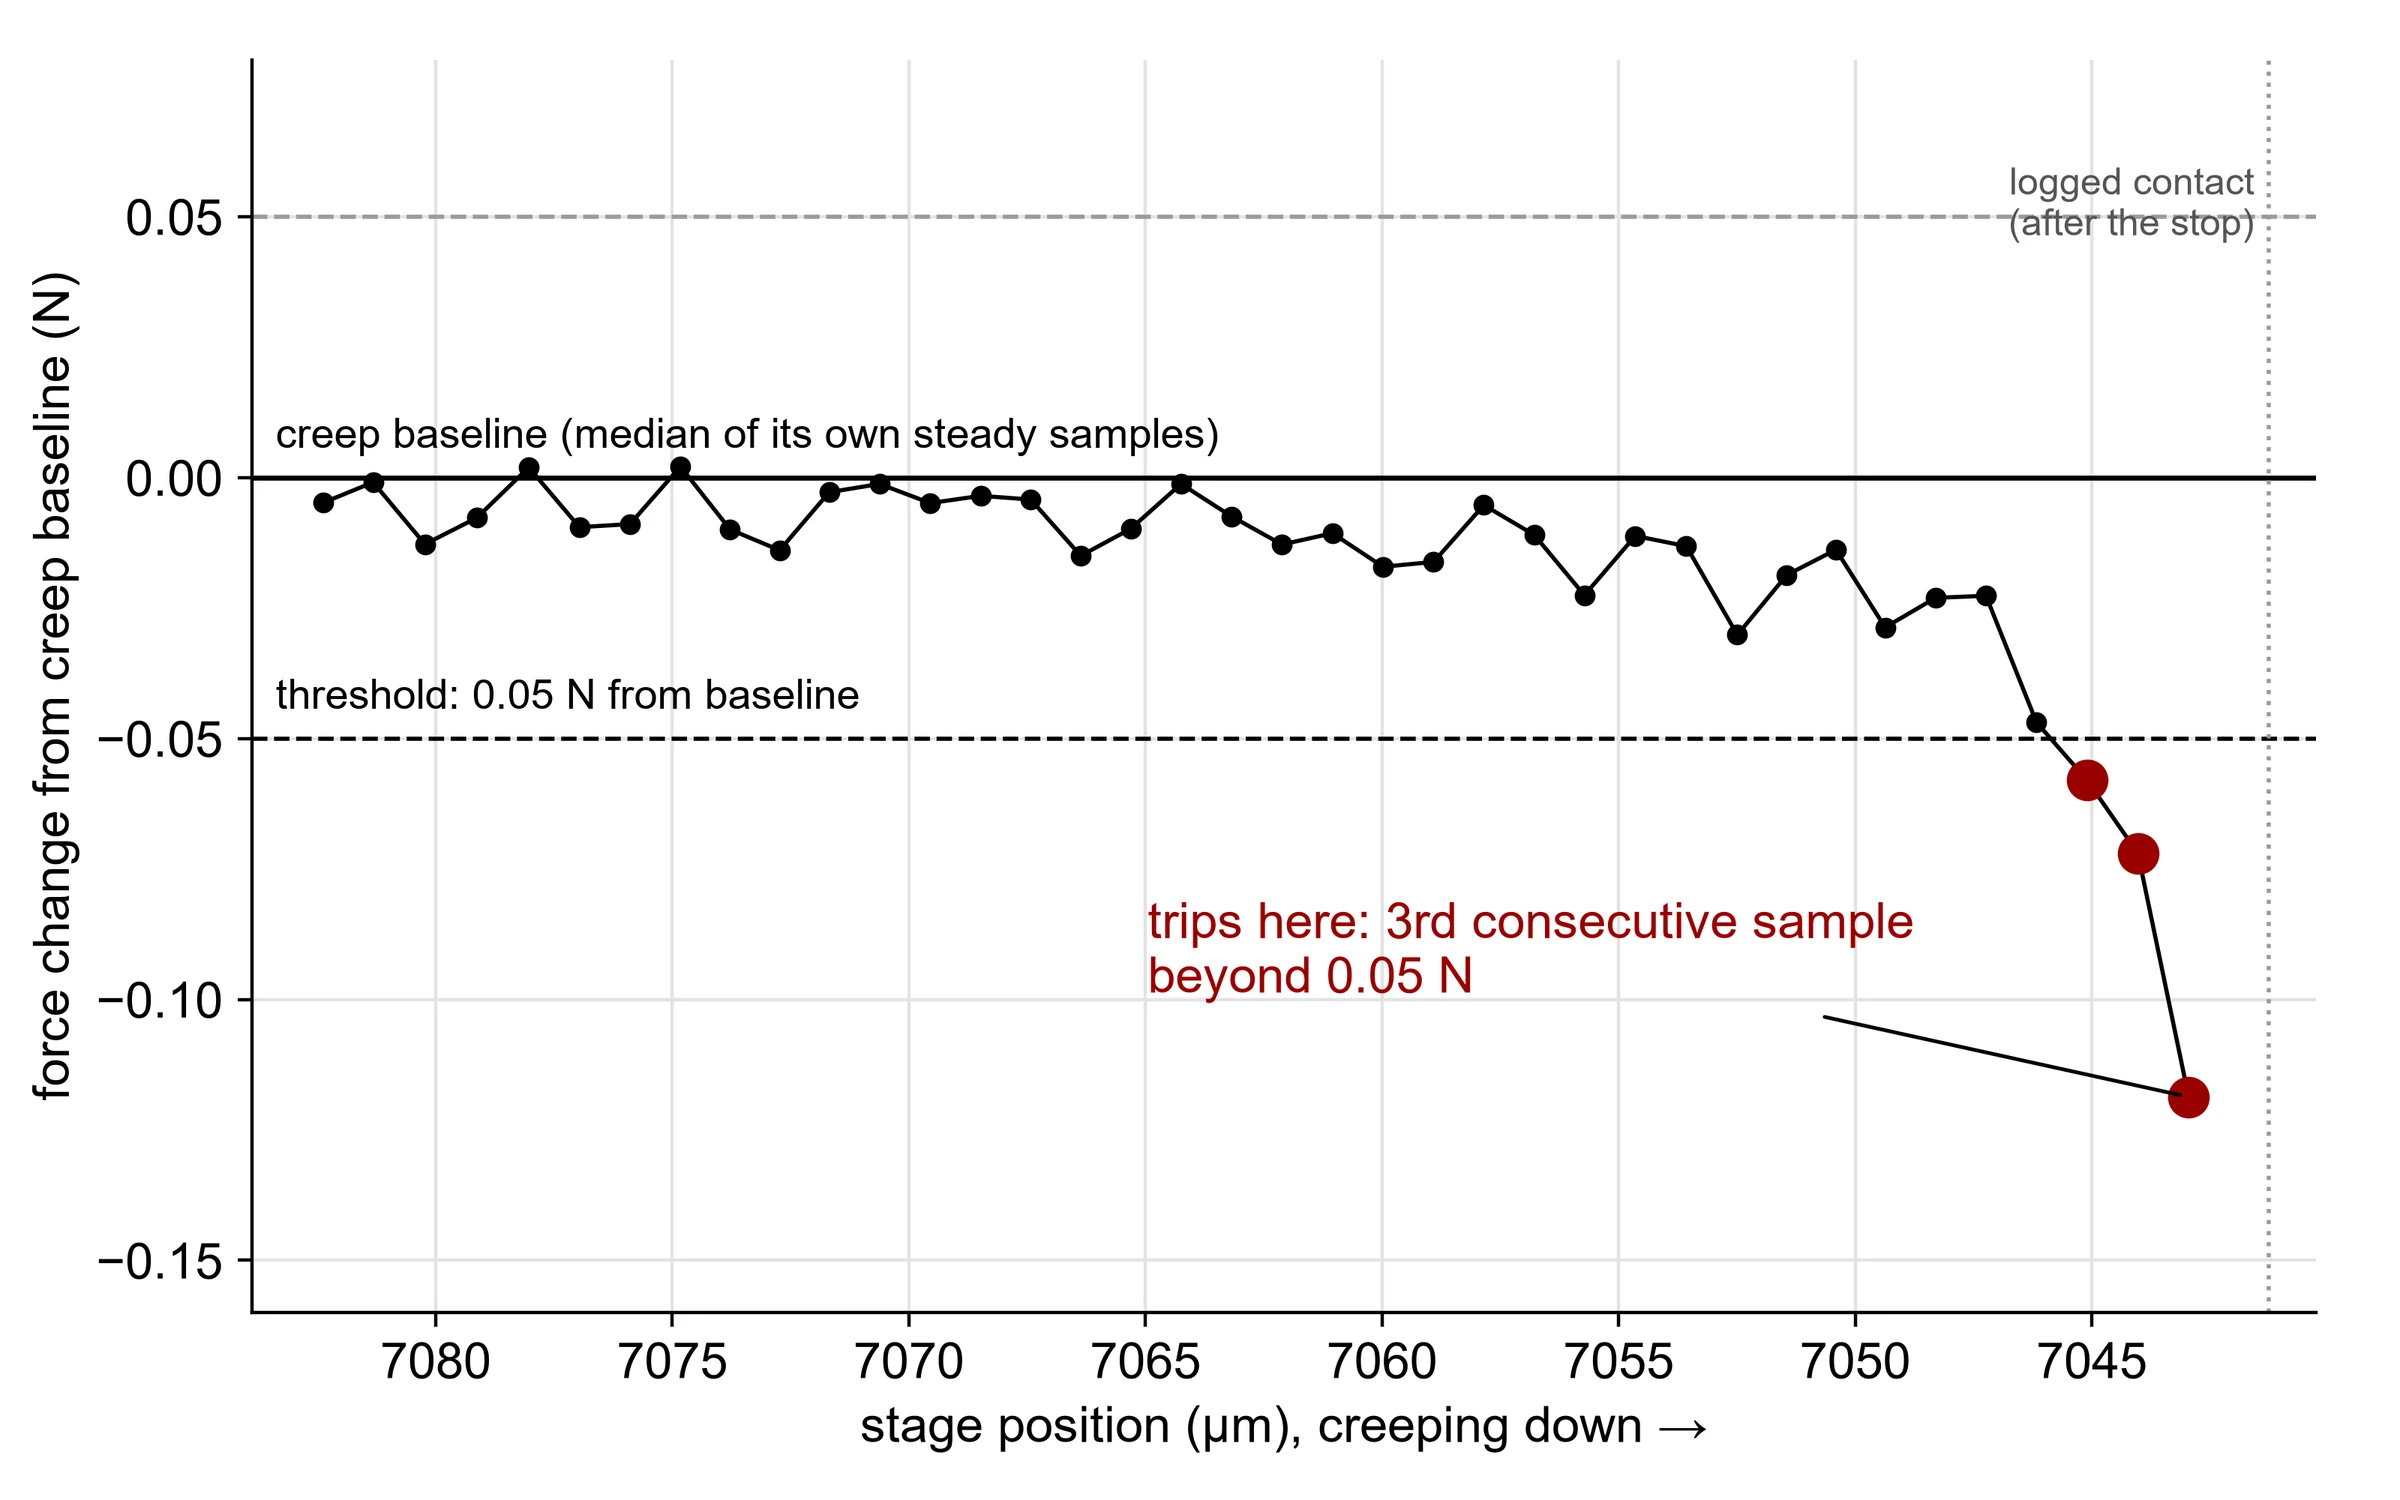
While creeping toward the wafer, the rig first learns its own steady moving force, then declares contact only when three samples in a row leave a ±0.05 N band around it. That adaptive baseline cancels friction, and the three-sample persistence filter rejects single noise spikes.
859for counts, _us, _recv in new_samples:
# ... skip the first samples while the stage accelerates863 if ref is None:
864 ref_buf.append(counts)
865 if len(ref_buf) >= ref_samples:
866 ref = sorted(ref_buf)[len(ref_buf) // 2] # median = steady creep force869 continue
870 if abs(counts - ref) > threshold_counts:
871 consecutive += 1
872 if consecutive >= need_consecutive:
873 return "contact"
874 else:
875 consecutive = 0 # must be a RUN, not N scattered excursions
The rule on a real touch-off: it trips on the third consecutive sample past the threshold.
Debugging
Four problems stood between the rig and trustworthy data. Each went through the same loop: define the symptom, form a hypothesis, run a test that changes one variable, then confirm the fix against a baseline.
Force traces came out flat, as if nothing was touching the sensor.
Cause
The cell was bolted through its body, creating a parallel load path: the force went around the beam that actually senses strain.
Fix
Designed and machined a part replacing the clevis pin, making the cell a pinned in-line link so it carries the full axial load.
Result
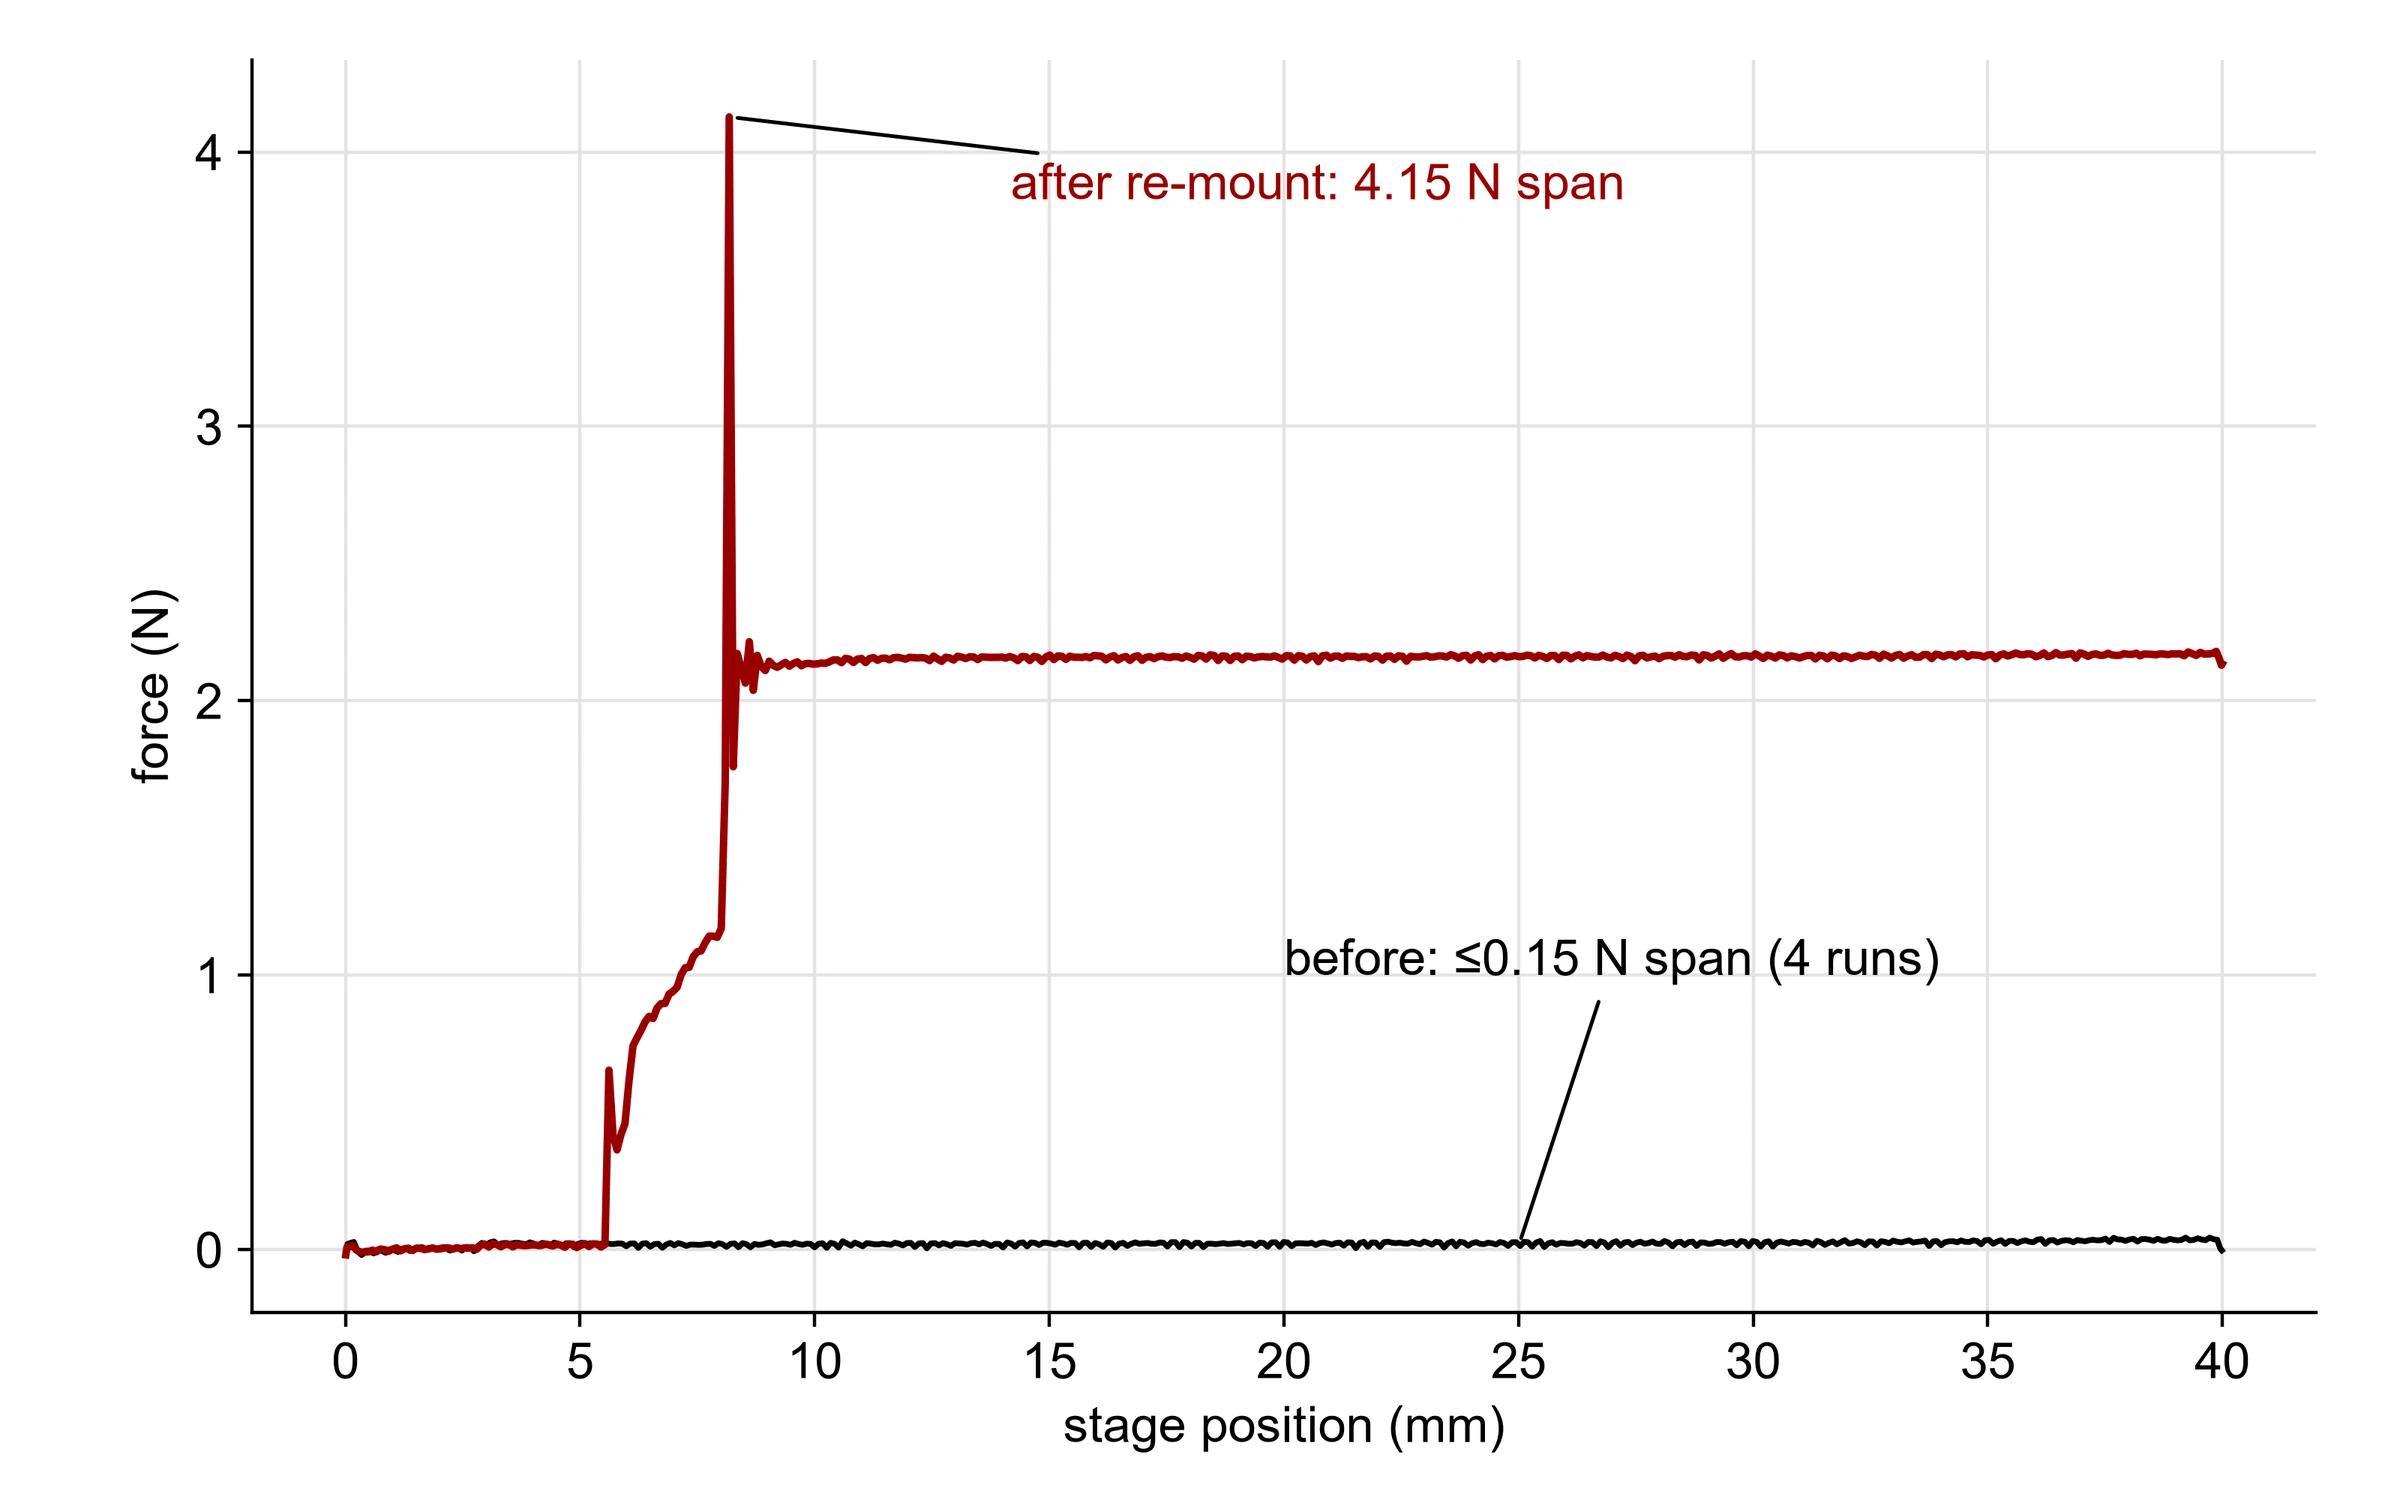
On the same 40 mm stroke, with identical code and settings, the measured force span went from at most 0.15 N to 4.15 N.
Same stroke, before and after re-mounting the load cell in series.
Problem 2
Friction characterization and bidirectional reversal test
False touch-offs from friction
Symptom
The rig sometimes “touched off” with nothing there.
Test
Moved the stage at several speeds, then approached the same positions from both directions, fully stopping before each reading.
Cause
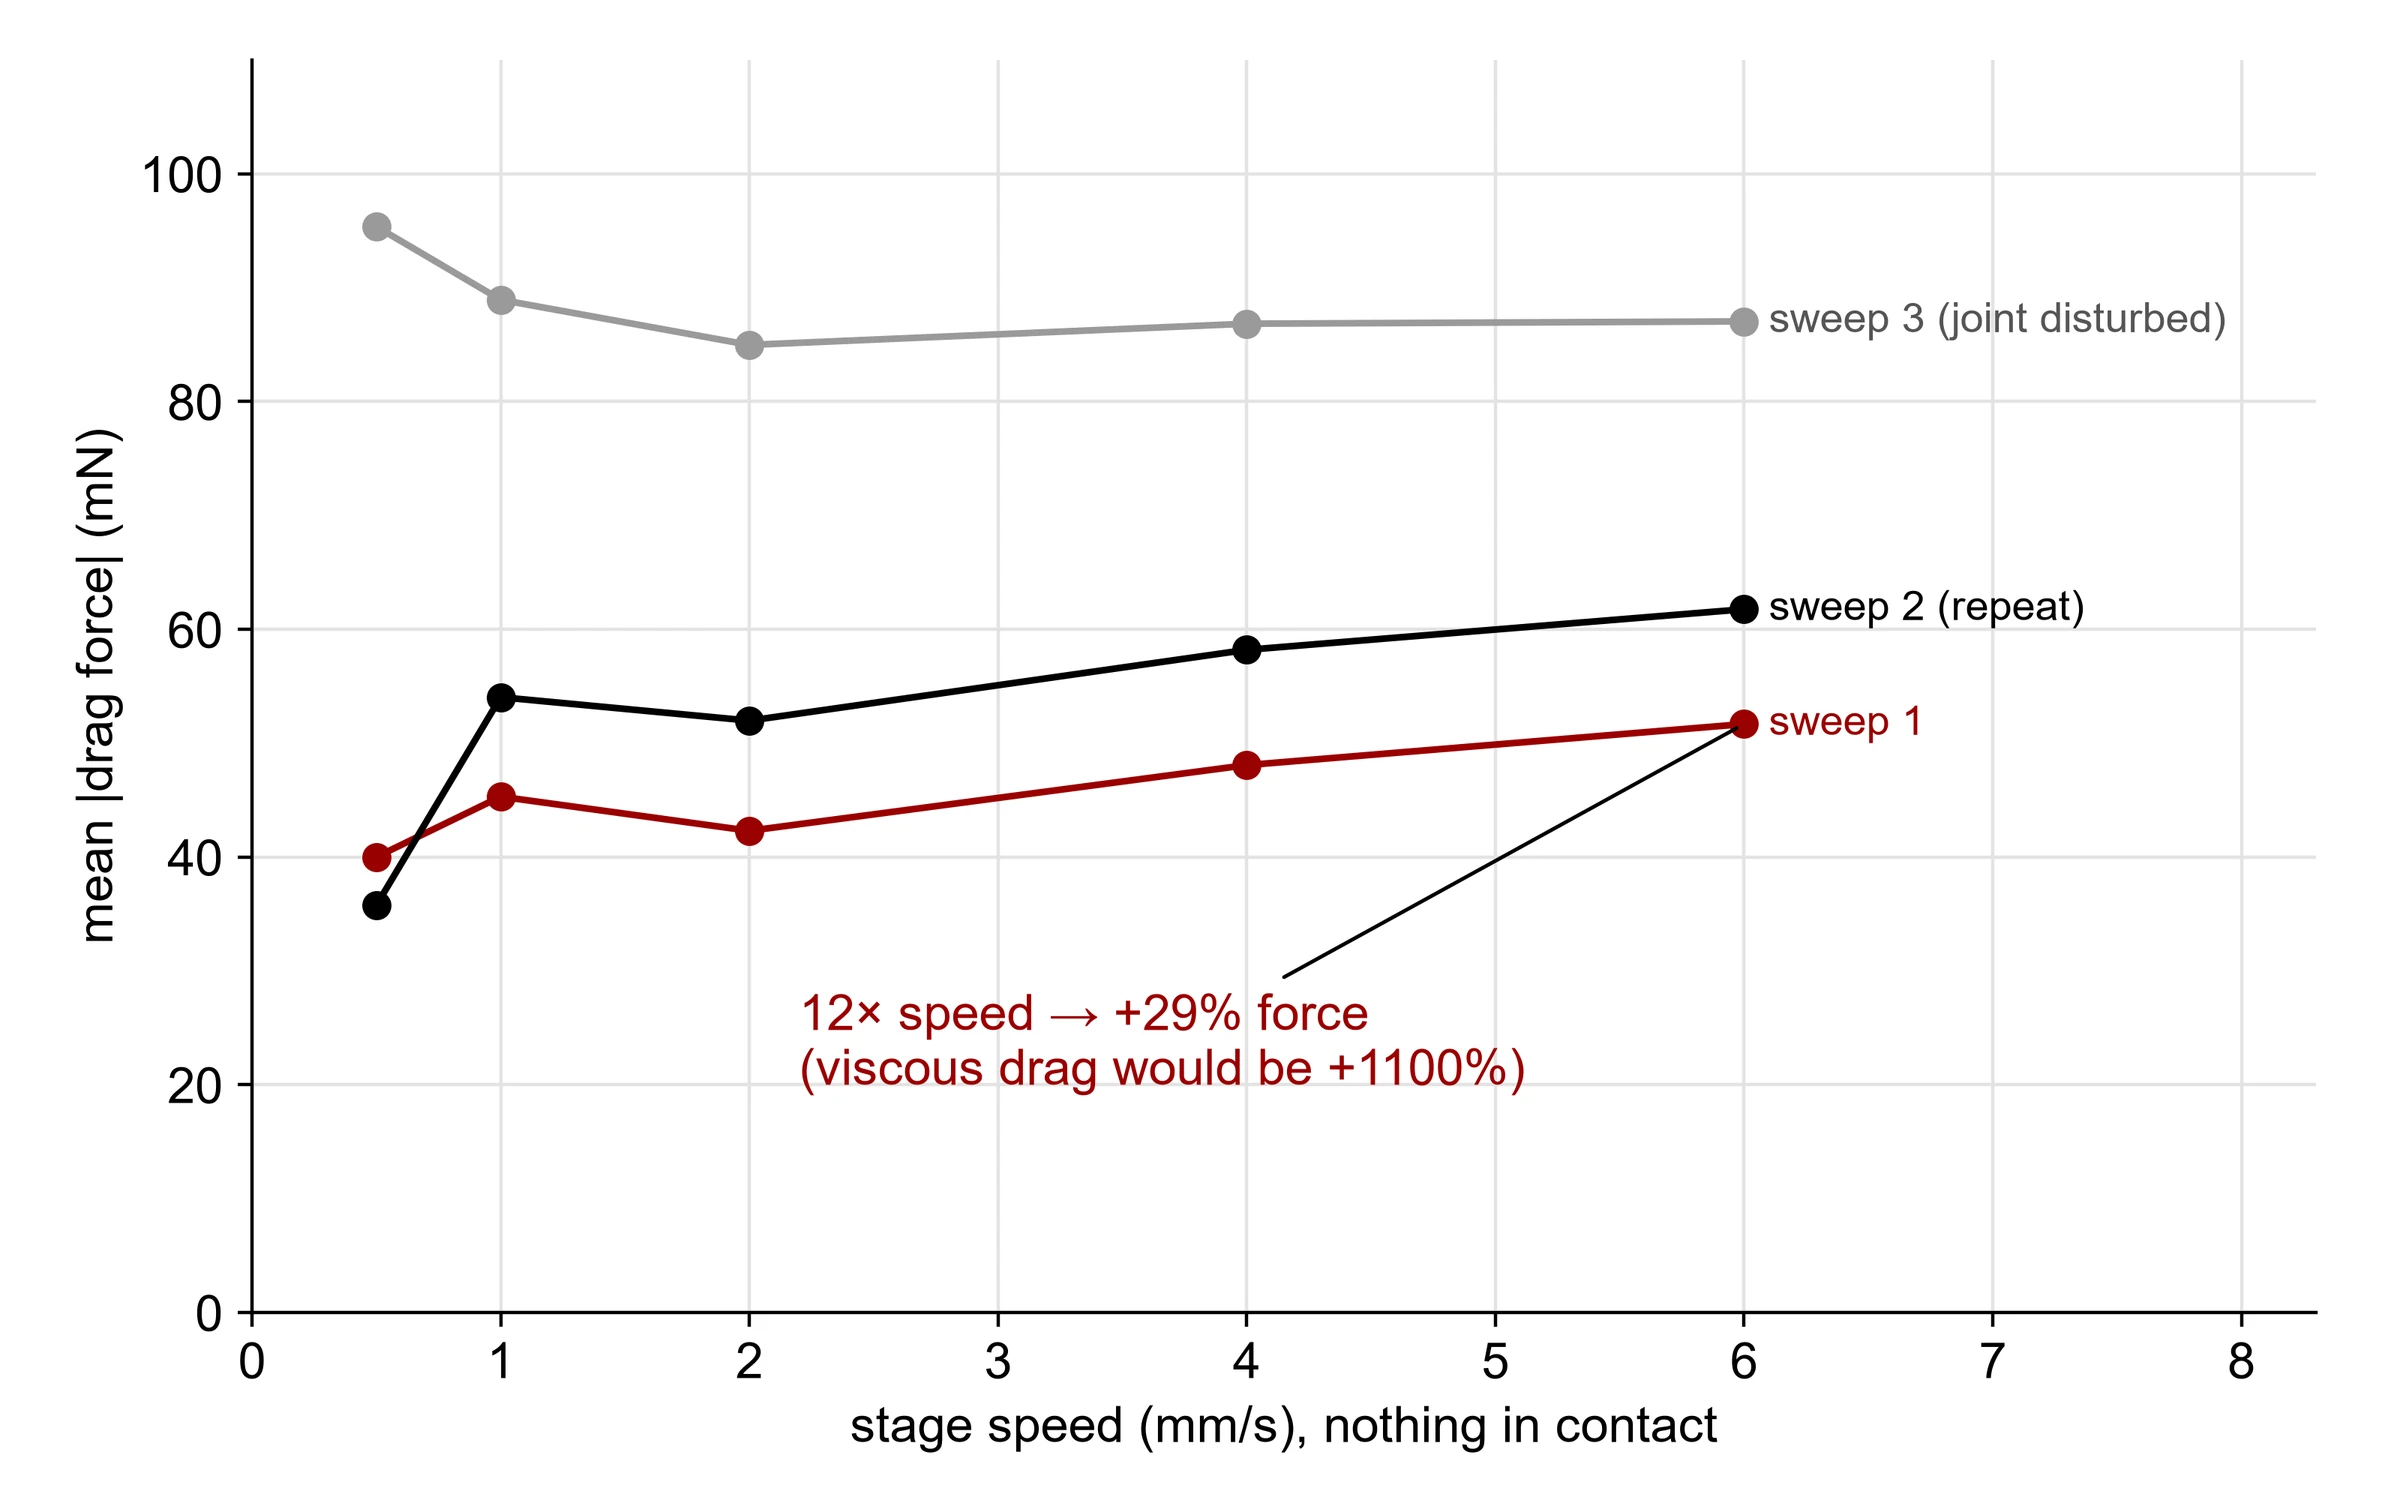
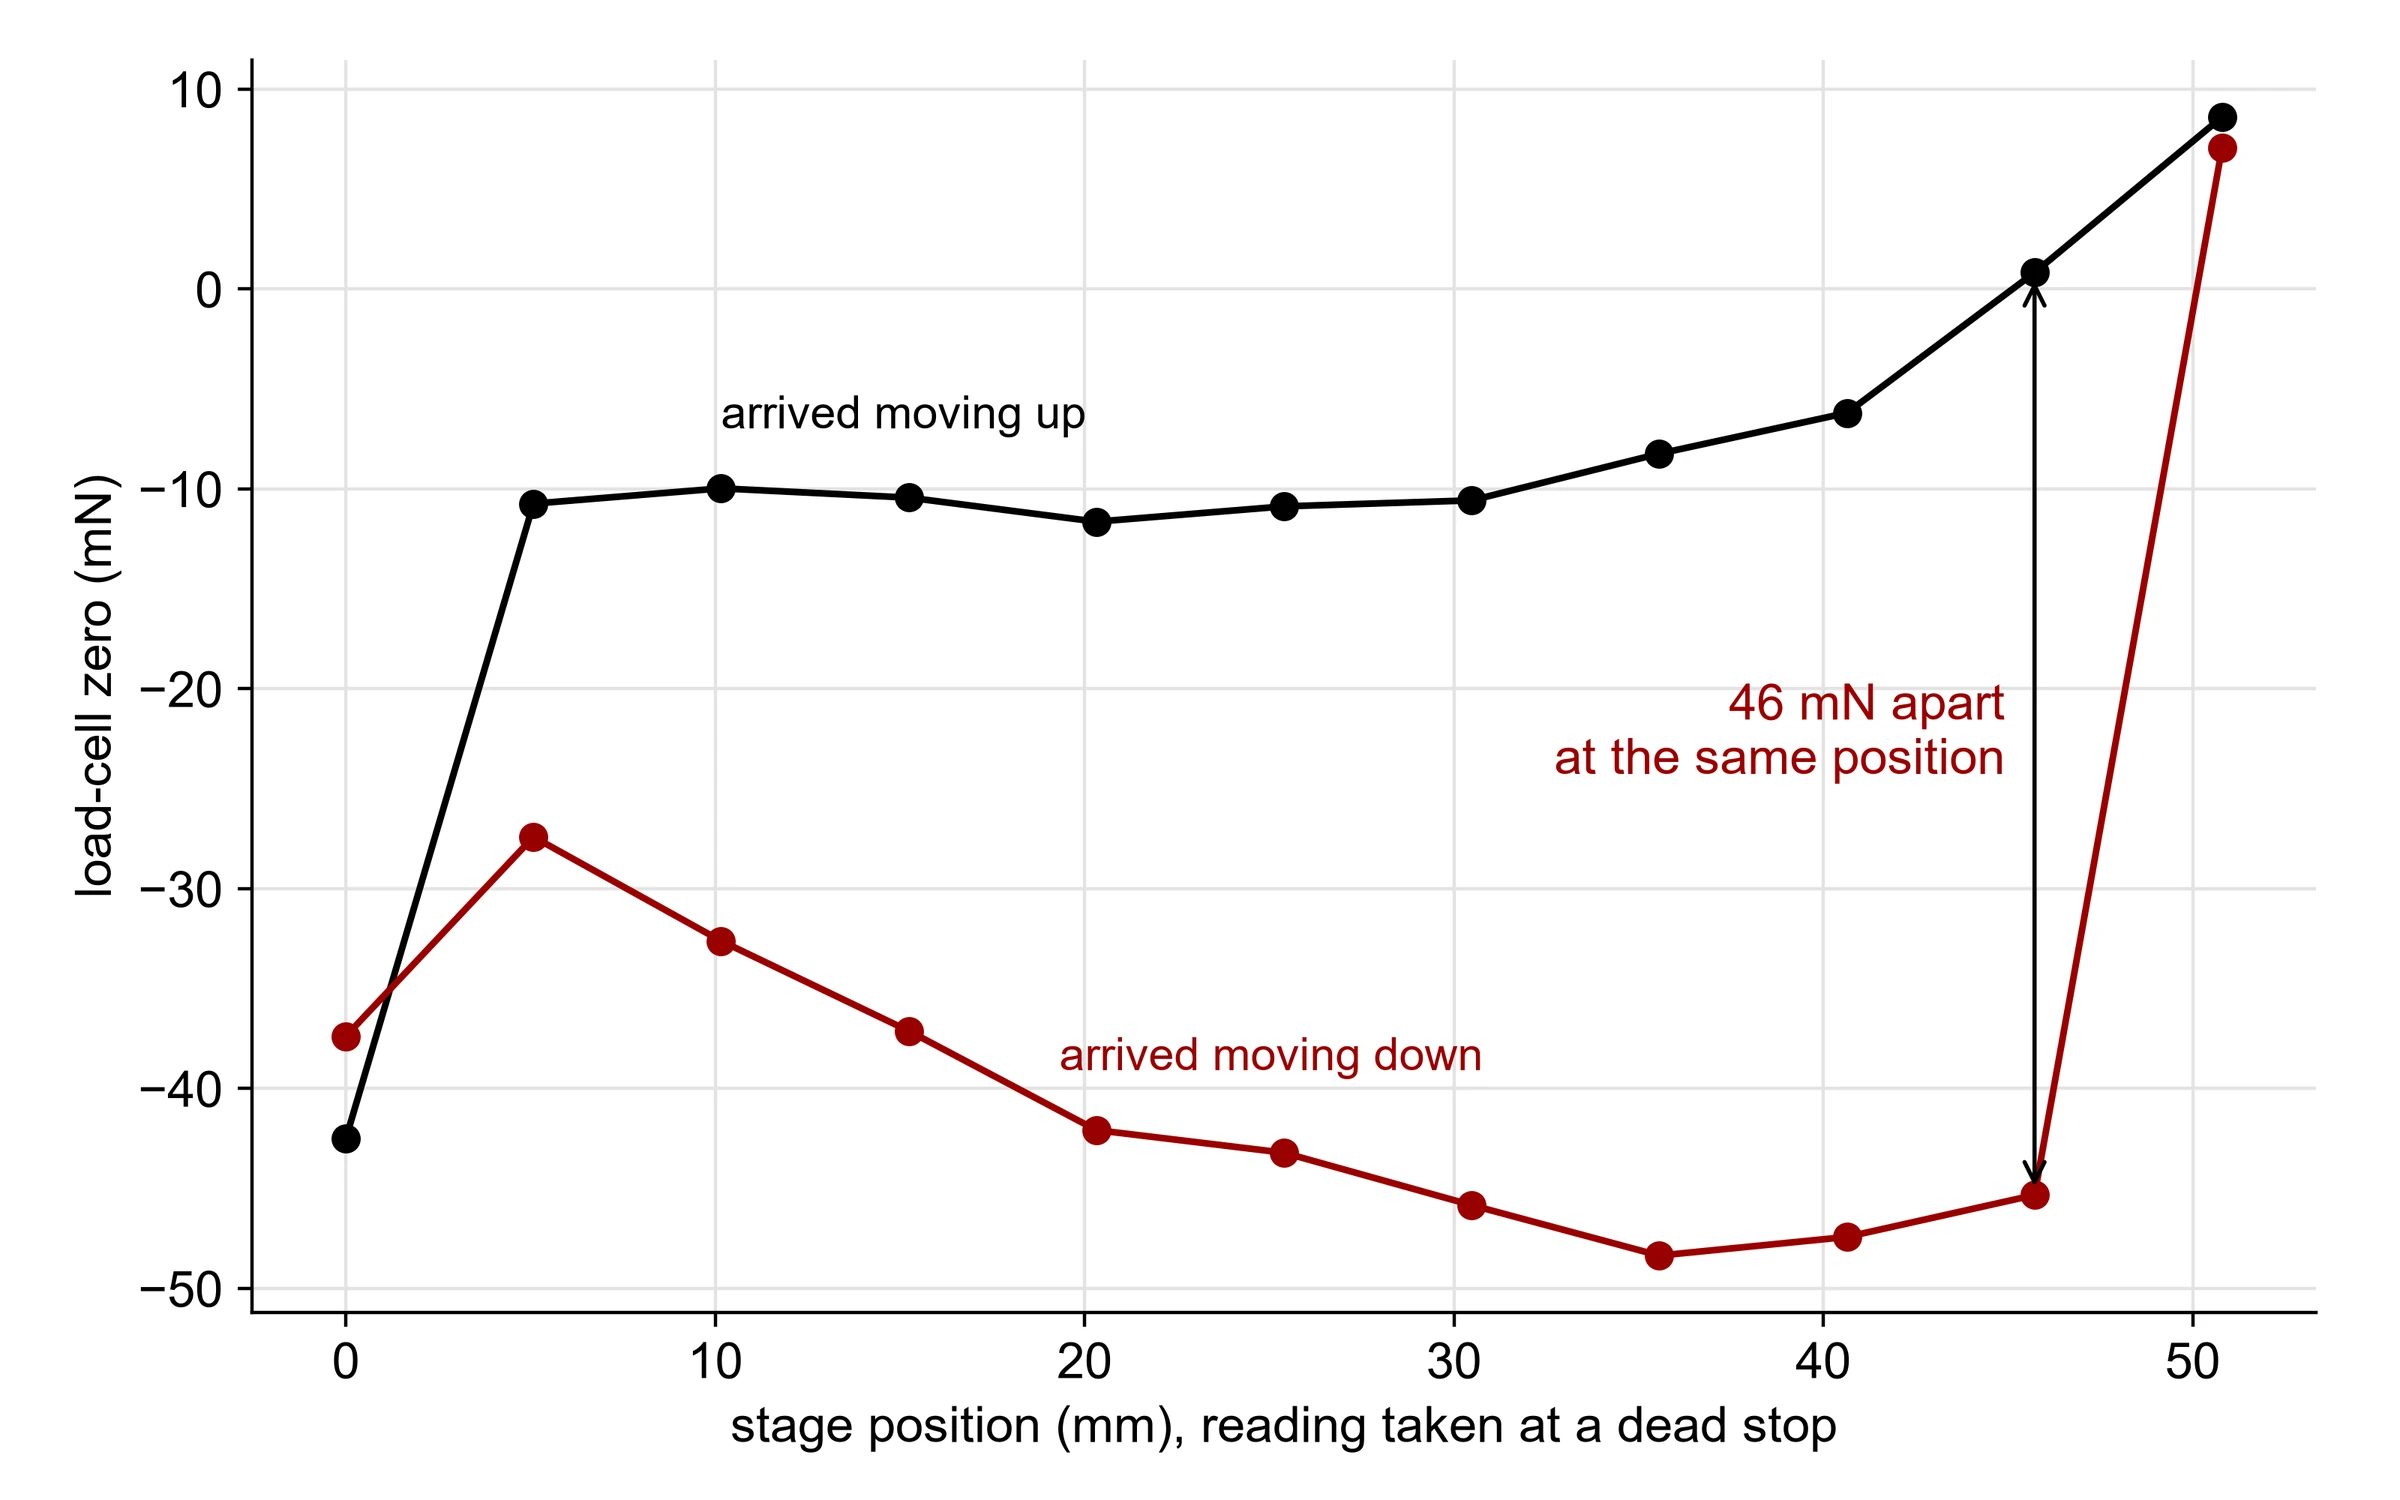
A 12× speed increase raised the drag only 29%, where viscous drag would have risen 1100%: Coulomb (dry) friction. The zero also depended on which way the stage last moved, 46 mN apart at the same position: direction-dependent hysteresis.
Result
Referencing touch-off to the creep’s own steady force took false touch-offs from 2 of 2 runs to 0 of 33.
Drag barely changes with speed: dry friction, not viscous.The zero depends on approach direction, not position.
Problem 3
A/B/A paired experiment and FFT vibration-source identification
A 29.1 Hz tone from the vacuum pump
Symptom
Noise at contact jumped when the vacuum was on.
Test
At contact with the stage stationary, cycled the pump off, on, off: three cycles per session, three sessions. An FFT found the dominant frequency.
Cause
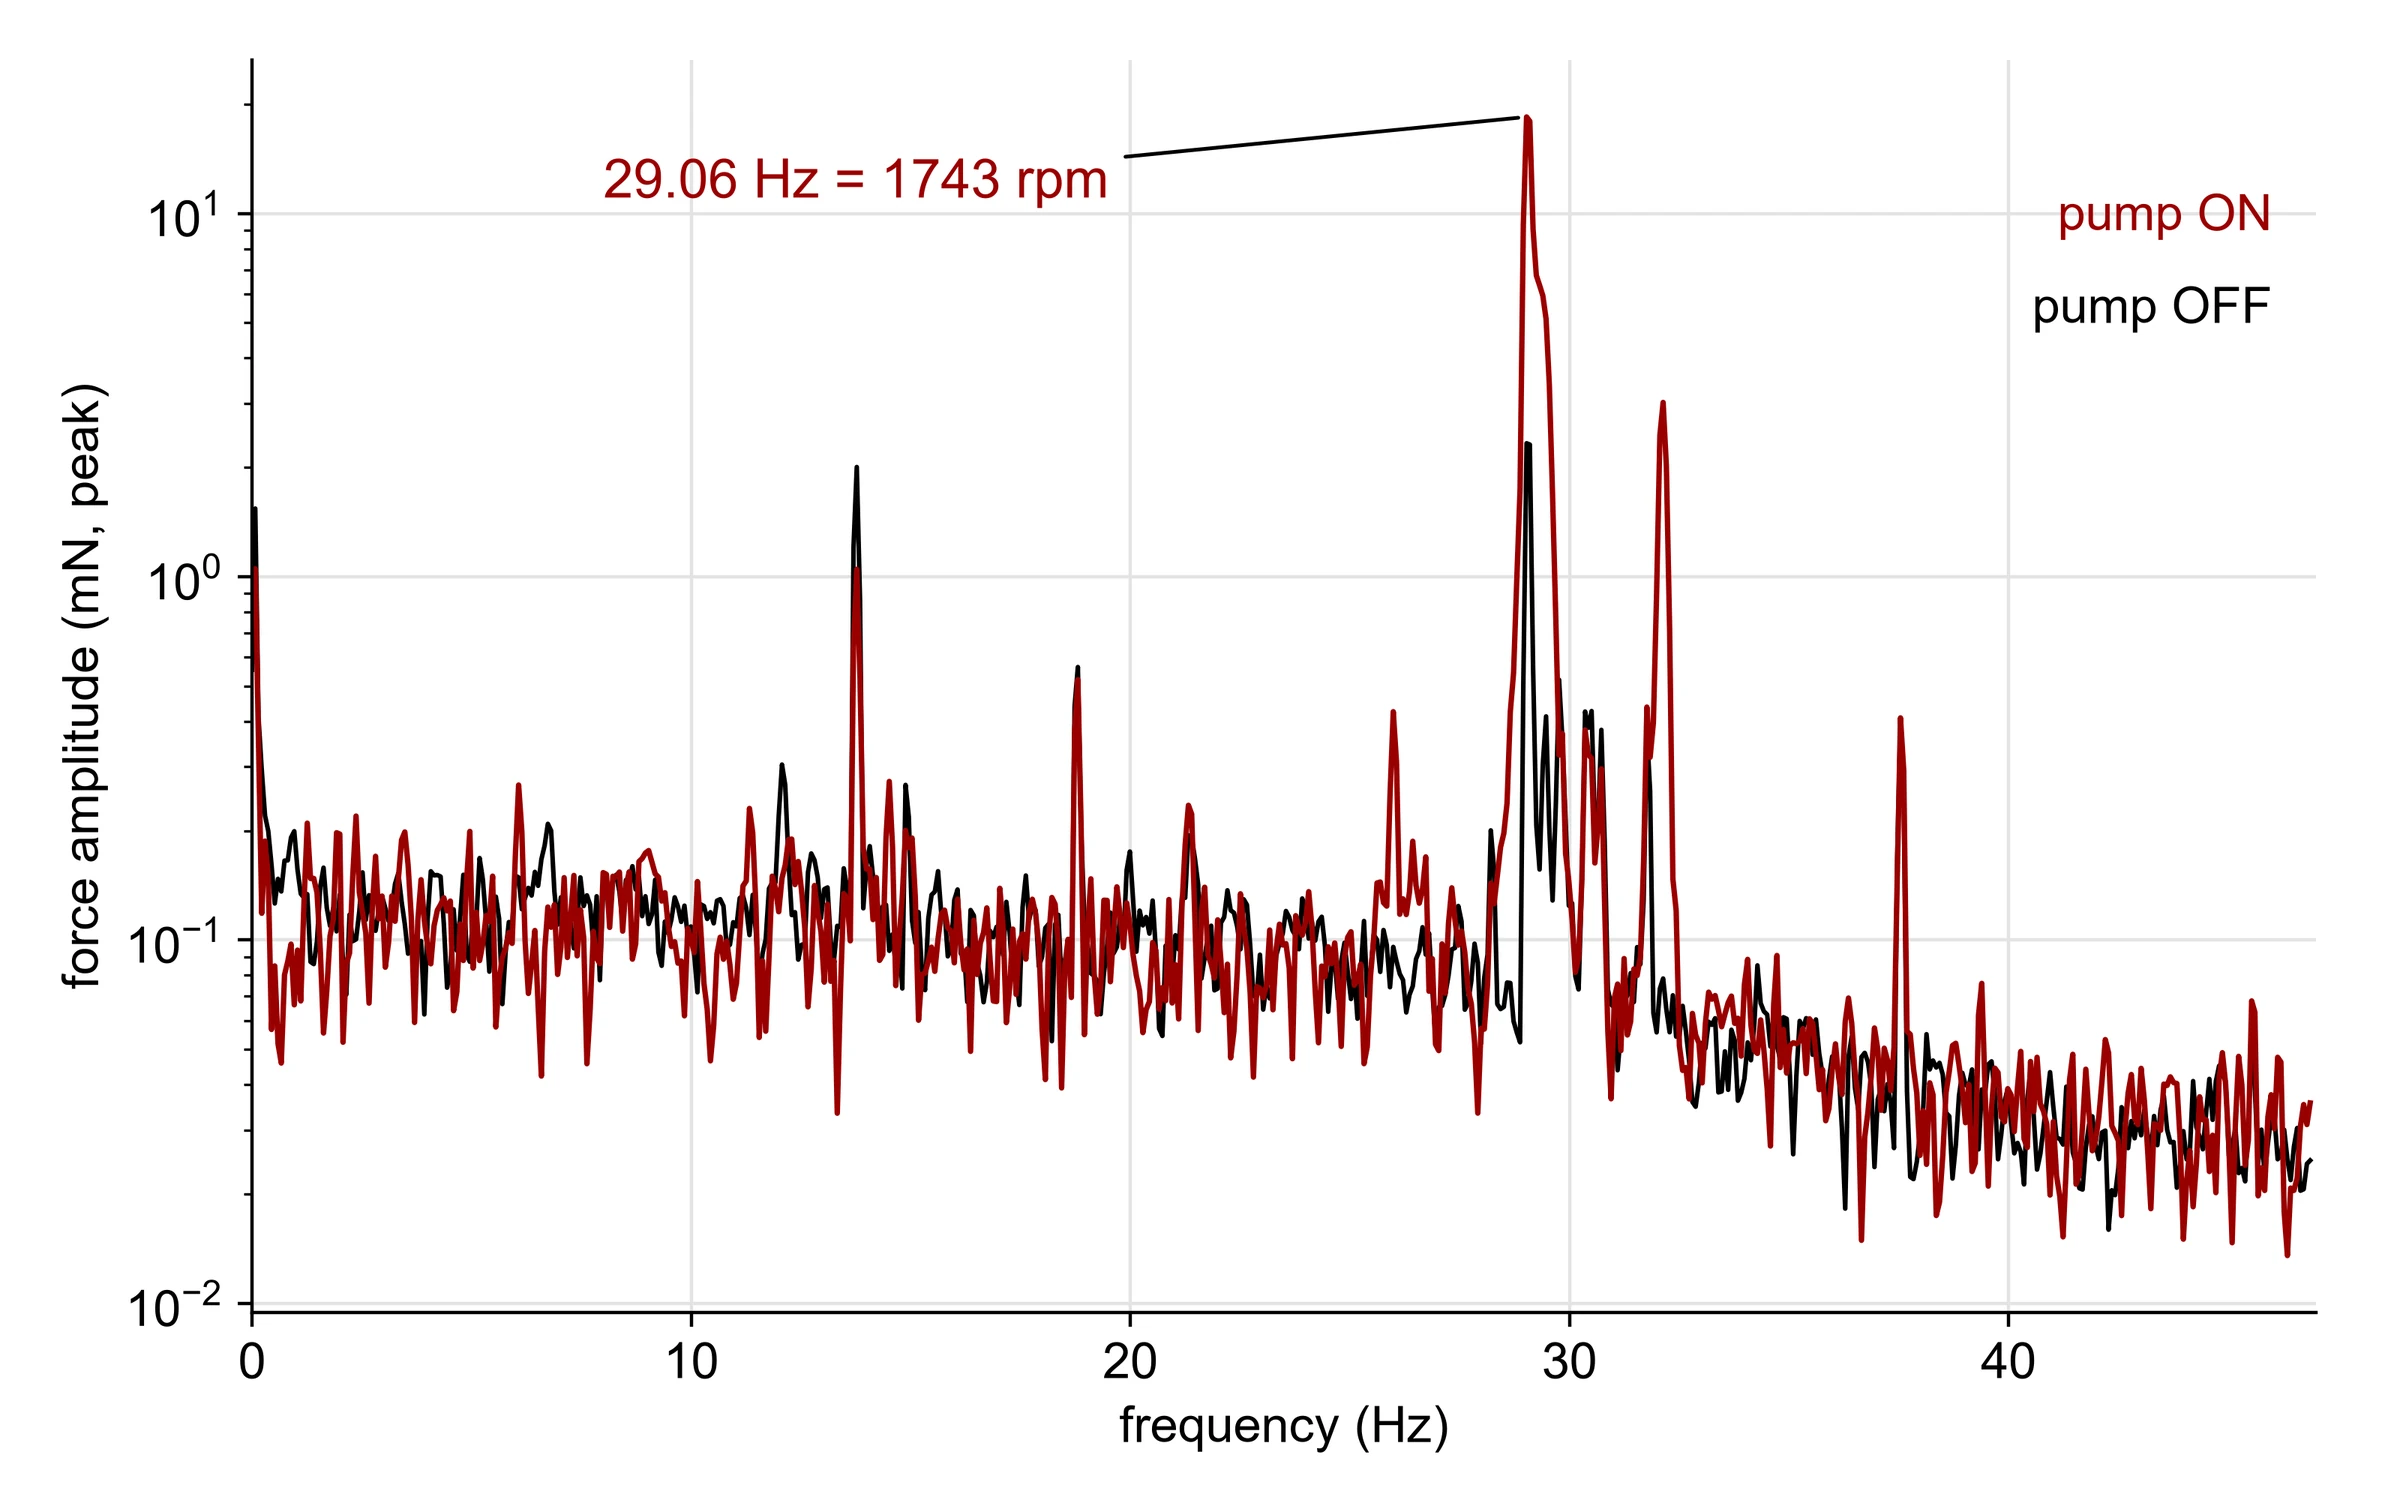
The pump raised noise 5.8–8.5×. Its spectral line at 29.06 Hz is 1743 rpm, within 0.4% of the motor’s 1750 rpm nameplate: the pump’s 1× shaft speed. Shifting the sample rate left the line in place, ruling out aliasing.
Result
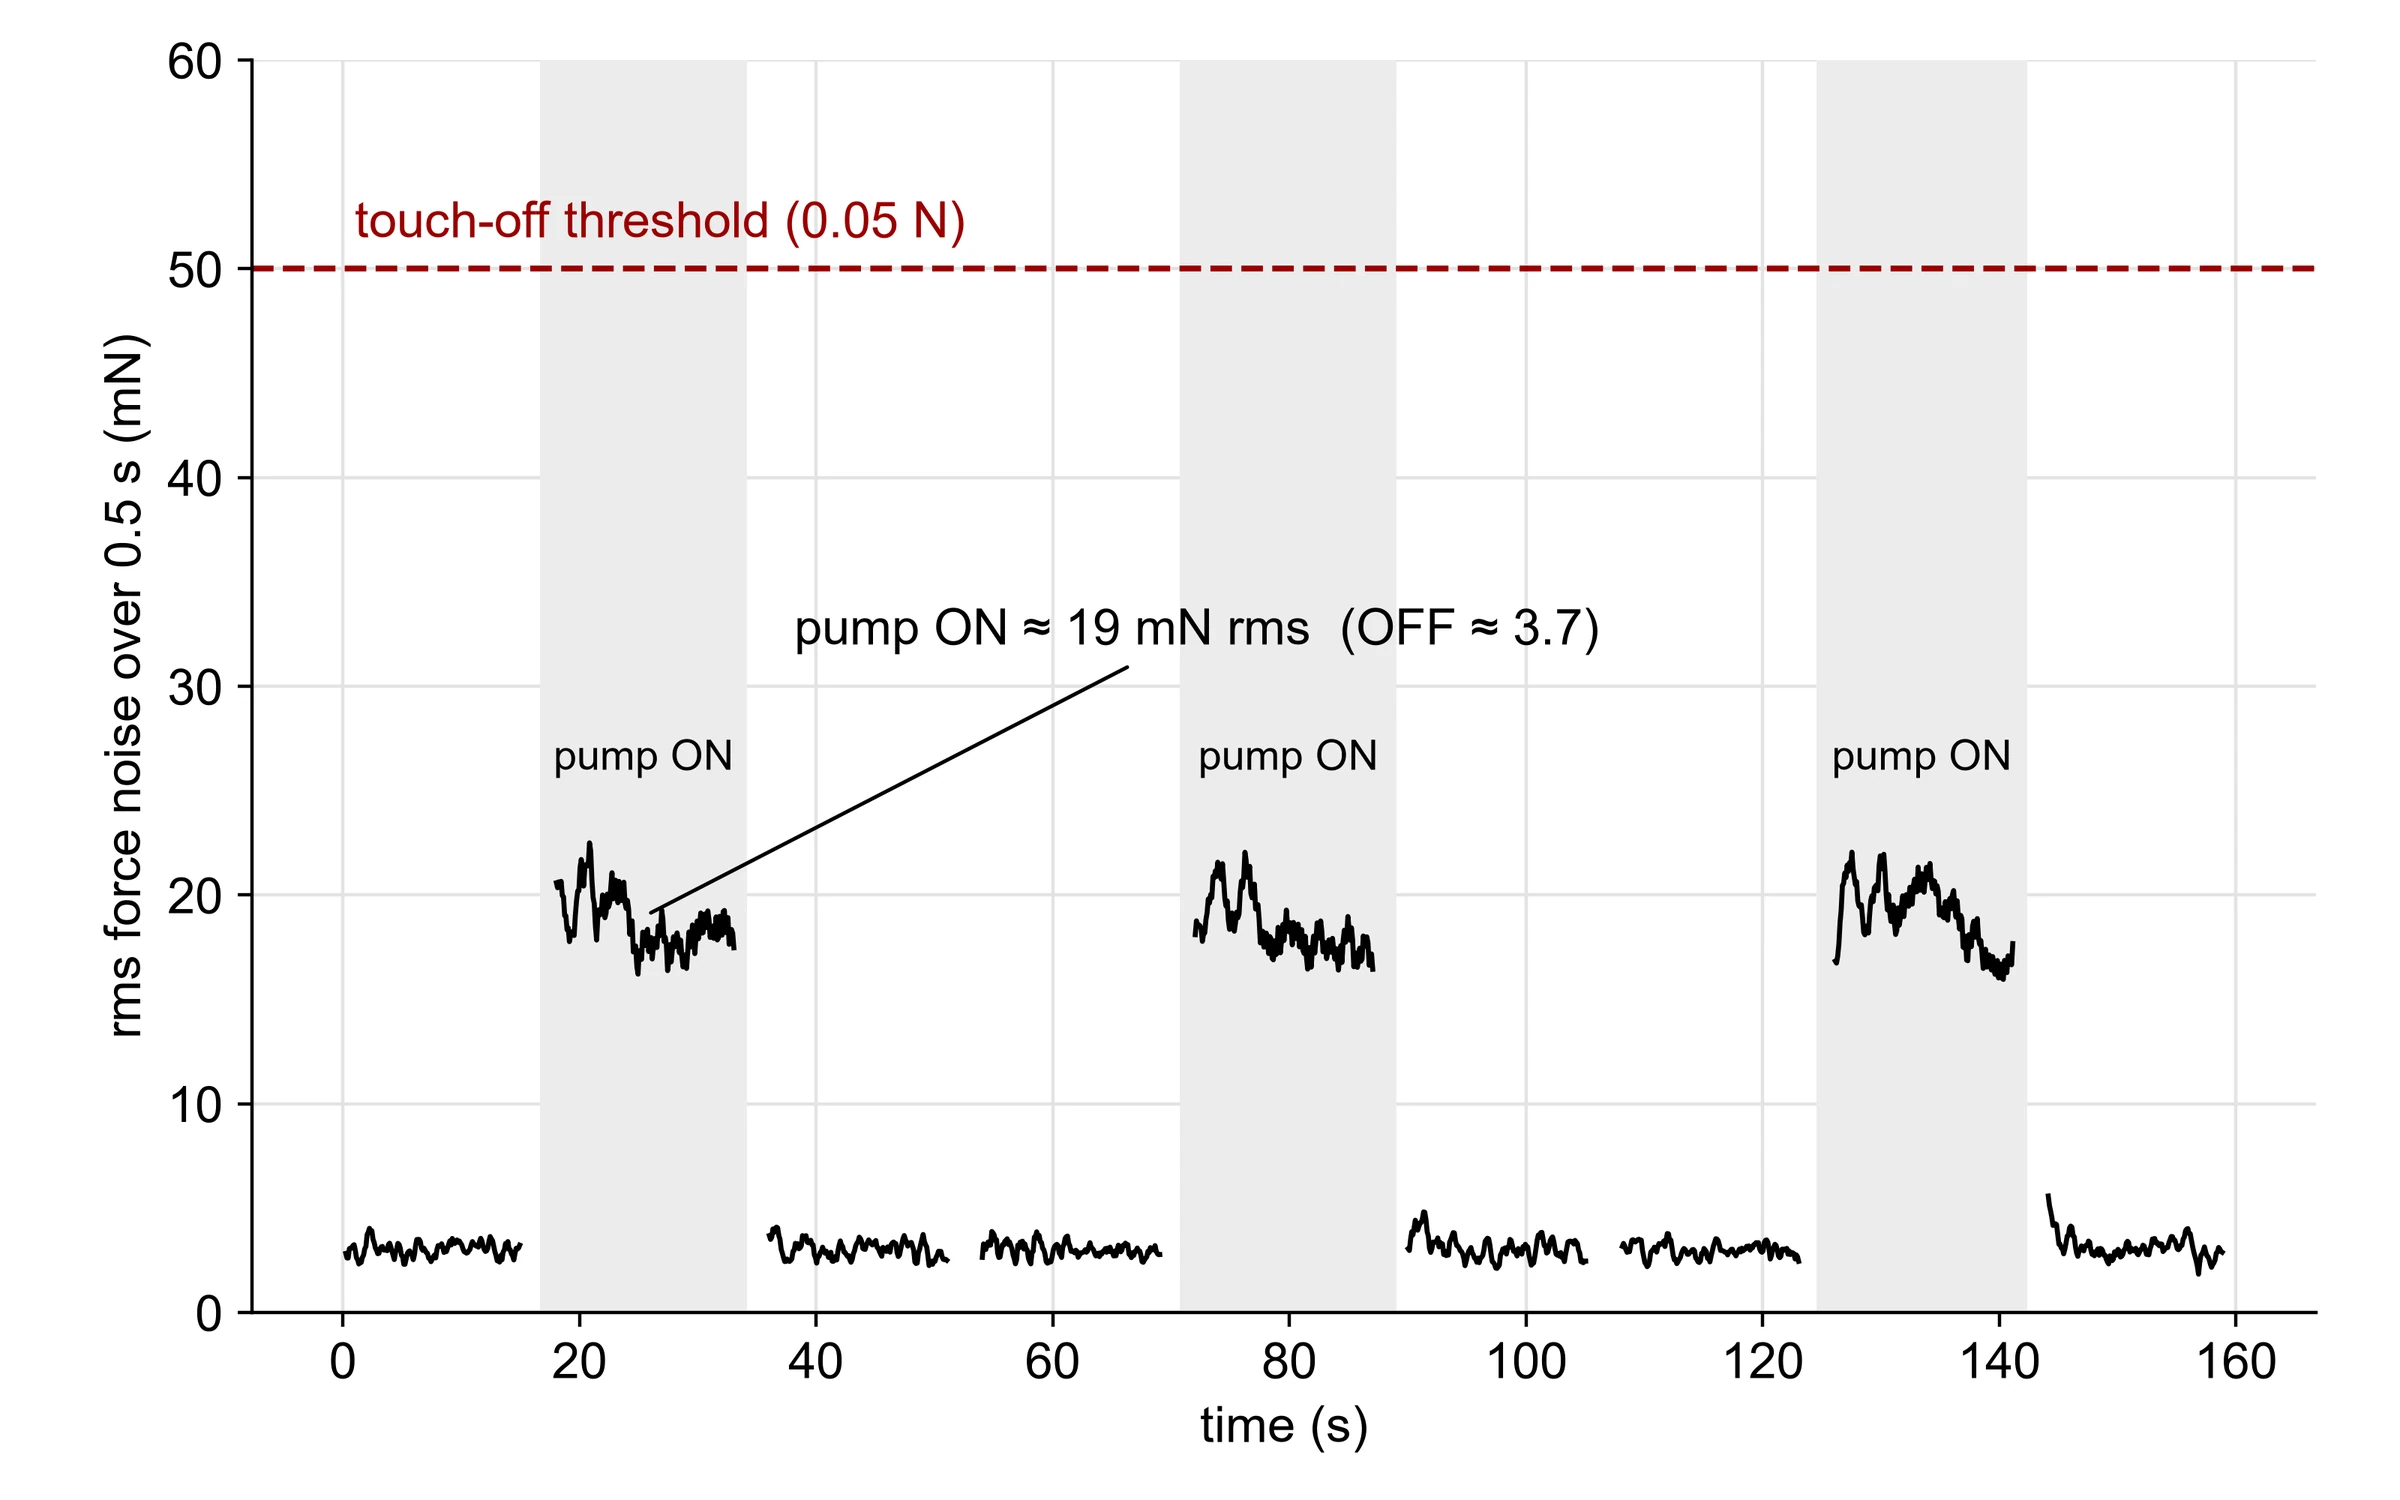
With the pump on, peak noise reached 52 mN, past the 50 mN touch-off threshold. Sequencing touch-off before the vacuum engages keeps peak noise at 31 mN, a 19 mN margin.
The pump adds one dominant line: 29.06 Hz, its shaft speed.Three off/on/off cycles at contact: about 3.7 mN rms off, 19 mN on.
Problem 4
Fracture-mechanics energy criterion (G vs Gc)
The nickel film was too thin to spall
Symptom
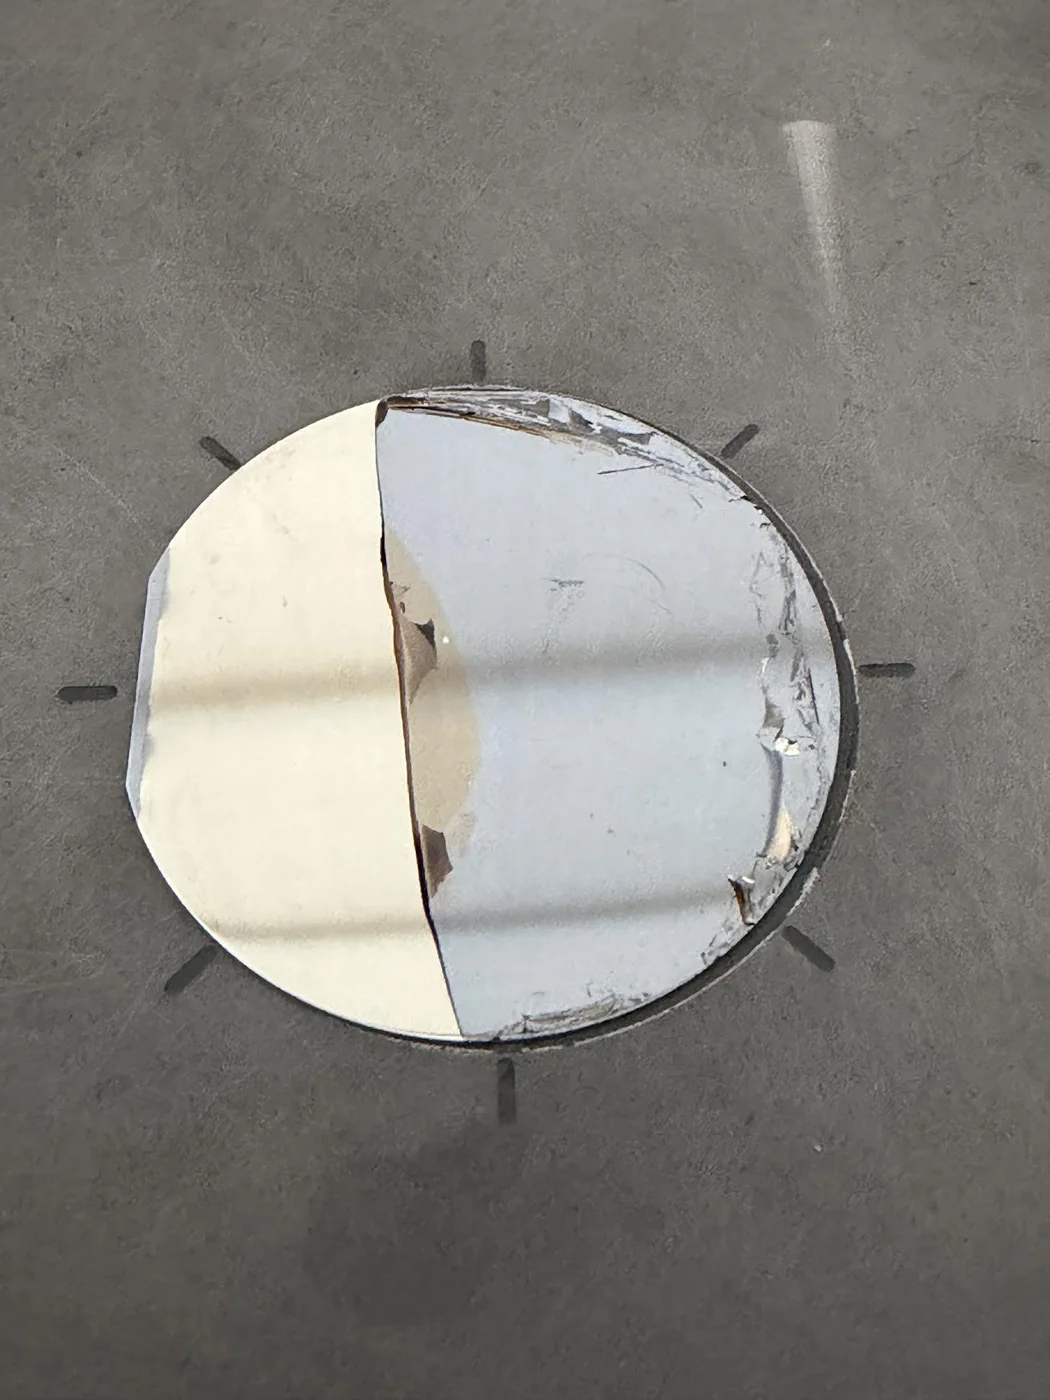
The plated film released at its interface instead of spalling the silicon underneath.
Test
Measured the film by profilometry and compared the elastic energy it stores with the fracture energy silicon needs.
Result
The 1.5 µm film stored 0.8–1.4 J/m² against the 2–4 J/m² needed, so I recommended thicker nickel plating.
A partial release: the film lifted at its interface rather than taking silicon with it.
Results
What I improved
≤0.15 → 4.15 NMeasured force span on the same stroke, after putting the load cell in series
46.8 → 93.9 HzSample rate, doubled by removing a redundant firmware read
2/2 → 0/33Runs with a false touch-off, after self-referencing the creep